Financial Institutions Using MeridianLink Can Now Offer More Convenient, Secure Payment and Account Funding Methods to Members
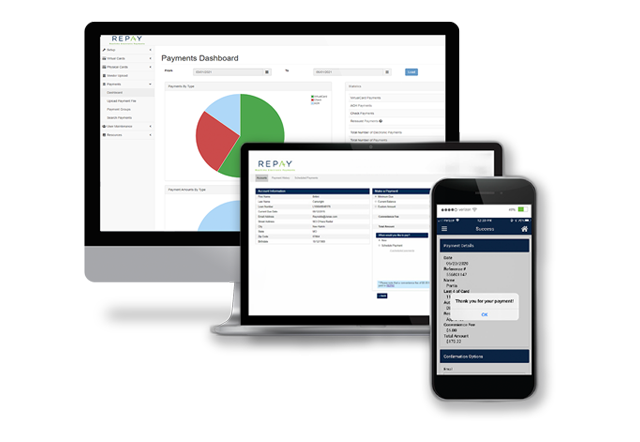
ATLANTA--(BUSINESS WIRE)--Repay Holdings Corporation (NASDAQ: RPAY) (“REPAY”), a leading provider of vertically-integrated payment solutions, today announced new enhancements to the company’s integration with MeridianLink, Inc. (NYSE: MLNK), a leading provider of modern software platforms for financial institutions and consumer reporting agencies. REPAY’s innovative, trusted payment technology now enables credit unions and banks in MeridianLink’s network to offer new members streamlined account funding via debit card, ACH and digital wallets, including Apple Pay and Google Pay.
Expanding account funding options with REPAY’s integrated payment technology enables financial institutions that use MeridianLink® Opening to accept funds into new member accounts faster and improve the consumer experience both in-branch and online. Providing a variety of convenient account funding methods, leveraging the same verifiable payment methods consumers prefer to use daily, simplifies the onboarding process for both credit unions and their members.
"We strive to continually enhance our platforms in strategic ways that strengthen our customers' business capabilities while simultaneously addressing evolving member needs,” said Megan Pulliam, SVP, MeridianLink® Marketplace. “Flexible account funding options, enabled by our partnership with REPAY, are an essential advantage for our financial institutions and will enable them to uphold the high standards of customer service and convenience members have come to expect."
These enhancements supplement REPAY’s existing integration with MeridianLink® Collect, which optimizes loan collection operations by simplifying accounting and consumer payment processes. REPAY’s secure payment solutions enable MeridianLink’s broad network of financial institution customers to streamline processing efficiencies by accepting ACH and card payments via web, mobile, Interactive Voice Response (IVR) or text. Offering a wide variety of payment modalities provides borrowers with options to make loan payments in the way that is most convenient for them and improves the overall experience.
“As digital payment options increase in consumer popularity, offering convenient account funding and payment methods is critical to attracting and retaining new members,” said Jake Moore, EVP, Consumer Payments, REPAY. "Our expanded partnership with MeridianLink empowers financial institutions and consumers to build trust and forge stronger relationships as a result of REPAY’s advanced payment technology solutions."
Regardless of payment method, REPAY’s integrated platform tracks, logs and posts payment data in real time, ensuring payment updates and information are accurately reflected in credit unions’ records immediately after a payment is submitted, mitigating the risk of invalid penalties and unnecessary collection efforts that are triggered for past-due payments. This not only smooths accounting processes for credit unions and banks but also supports better relationships with members due to improved confidence and communication.
About REPAY
REPAY provides integrated payment processing solutions to verticals that have specific transaction processing needs. REPAY’s proprietary, integrated payment technology platform reduces the complexity of electronic payments for clients, while enhancing the overall experience for consumers and businesses.
About MeridianLink
MeridianLink® (NYSE: MLNK) empowers financial institutions and consumer reporting agencies to drive efficient growth. MeridianLink’s cloud-based digital lending, account opening, background screening, and data verification solutions leverage shared intelligence from a unified data platform, MeridianLink® One, to enable customers of all sizes to identify growth opportunities, effectively scale up, and support compliance efforts, all while powering an enhanced experience for staff and consumers alike.
For more than 25 years, MeridianLink has prioritized the democratization of lending for consumers, businesses, and communities. Learn more at www.meridianlink.com.
Contacts
Investor Relations Contact for REPAY:
IR@repay.com
Media Relations Contact for REPAY:
Kristen Hoyman
khoyman@repay.com
Media Relations Contact for MeridianLink:
Erica Bigley
Erica.Bigley@MeridianLink.com
March 12, 2025.
Company Provides 2025 Outlook Including Accelerating Growth
Announced Conclusion of Strategic Review Process
Announced Increased Share Repurchase Program Authorization to $75 million
ATLANTA--(BUSINESS WIRE)--May 12, 2025-- Repay Holdings Corporation (NASDAQ: RPAY) (“REPAY” or the “Company”), a leading provider of vertically-integrated payment solutions, today reported financial results for its first quarter ended March 31, 2025.
First Quarter 2025 Financial Highlights
($ in millions) | Q1 2024 | Q2 2024 | Q3 2024 | Q4 2024 | Q1 2025 | ||||||
Revenue | $80.7 | $74.9 | $79.1 | $78.3 | $77.3 | ||||||
Gross profit (1) | 61.5 | 58.6 | 61.6 | 59.7 | 58.7 | ||||||
Net (loss) income | (5.4) | (4.2) | 3.2 | (4.0) | (8.2) | ||||||
Adjusted EBITDA (2) | 35.5 | 33.7 | 35.1 | 36.5 | 33.2 | ||||||
Net cash provided by operating activities | 24.8 | 31.0 | 60.1 | 34.3 | 2.5 | ||||||
Free Cash Flow (2) | 13.7 | 19.3 | 48.8 | 23.5 | (8.0) | ||||||
Free Cash Flow Conversion (2) | 38% | 57% | 139% | 64% | 24% |
(1) | Gross profit represents revenue less costs of services (exclusive of depreciation and amortization). |
(2) | Adjusted EBITDA, Free Cash Flow and Free Cash Flow Conversion are non-GAAP financial measures. See “Non-GAAP Financial Measures” and the reconciliation of Adjusted EBITDA, Free Cash Flow and Free Cash Flow Conversion to their most comparable GAAP measure provided below for additional information. |
“REPAY is focused on executing on core growth, which continues to reinforce the ongoing secular tailwinds and resiliency of our business model. Our Business Payments segment normalized gross profit growth1 accelerated to 12% year-over-year, driven by the strength of our core accounts payable business, the onboarding of new enterprise customers, and the success of recent monetization efforts. Free cash flow was impacted by one-time working capital impacts as well as previously announced client losses. We believe the reported first quarter growth rates do not fully reflect our underlying business trends, and in fact, our 2025 outlook includes sequential quarterly normalized gross profit growth1 resulting in a high single-digit to low double-digit fourth quarter growth rate, as well as free cash flow conversion accelerating throughout the year. Our core growth strategy remains robust, with a relentless focus on profitable growth, optimized payment flows, and operational efficiency to create lasting value for our shareholders,” said John Morris, Chief Executive Officer of REPAY.
“The Board has made the decision to conclude our strategic review process at this time. I am confident in REPAY’s ability to deliver growth and value for our shareholders in the near term and believe that we will be well positioned for positive organic results as we move through 2025. Additionally, we separately announced that our Board of Directors approved an increase in our share repurchase authorization by $25 million. I also want to express our heartfelt gratitude to Tim Murphy, our Chief Financial Officer, for his 11 years of dedicated service and partnership. Tim will be leaving REPAY in the coming days, and we all wish him every success in his future endeavors.”
First Quarter 2025 Business Highlights
The Company's achievements in the quarter, including those highlighted below, reinforce management's belief in the ability of the Company to drive durable and long-term growth across REPAY's diversified business model.
- Reported and normalized gross profit1 declines of 5% and 4% year-over-year due to impacts from previously announced client losses, which include certain losses due to consolidation
- Consumer Payments gross profit declined approximately 5% year-over-year, which was impacted by the previously announced client losses
- Business Payments normalized gross profit growth1 of approximately 12% year-over-year
- Accelerated AP supplier network to over 390,000, an increase of approximately 40% year-over-year
- Added three new integrated software partners to bring the total to 283 software relationships as of the end of the first quarter
- Instant funding volumes increased by approximately 19% year-over-year
- Added 14 new credit unions bringing total credit union clients to 343
2025 Outlook
For fiscal year 2025, the Company now expects:
- Sequential quarterly acceleration of normalized gross profit growth1, including a fourth quarter year-over-year growth rate of high-single digits to low double-digits;
- Free cash flow conversion expected to exceed 50% in the second quarter, accelerating above 60% by the fourth quarter of 2025
REPAY does not provide quantitative reconciliation of forward-looking, non-GAAP financial measures, such as forecasted normalized gross profit growth and Free Cash Flow Conversion, to the most directly comparable GAAP financial measure, because it is difficult to reliably predict or estimate the relevant components without unreasonable effort due to future uncertainties that may potentially have a significant impact on such calculations, and providing them may imply a degree of precision that would be confusing or potentially misleading.
1 Normalized gross profit growth is a non-GAAP financial measure that accounts for cyclical political media spending contributions. See “Non-GAAP Financial Measures” and the reconciliation to their most comparable GAAP measure provided below for additional information.
Segments
The Company reports its financial results based on two reportable segments.
Consumer Payments –The Consumer Payments segment provides payment processing solutions (including debit and credit card processing, Automated Clearing House (“ACH”) processing and other electronic payment acceptance solutions, as well as REPAY’s loan disbursement product) that enable REPAY’s clients to collect payments from and disburse funds to consumers and includes its clearing and settlement solutions (“RCS”). RCS is REPAY’s proprietary clearing and settlement platform through which it markets customizable payment processing programs to other ISOs and payment facilitators. The strategic vertical markets served by the Consumer Payments segment primarily include personal loans, automotive loans, receivables management, credit unions, mortgage servicing, consumer healthcare and diversified retail.
Business Payments –The Business Payments segment provides payment processing solutions (including accounts payable automation, debit and credit card processing, virtual credit card processing, ACH processing and other electronic payment acceptance solutions) that enable REPAY’s clients to collect payments from or send payments to other businesses. The strategic vertical markets served within the Business Payments segment primarily include retail automotive, education, field services, governments and municipalities, healthcare, media, homeowner association management and hospitality.
Segment Revenue, Gross Profit, and Gross Profit Margin
Three Months Ended March 31, | |||||||
($ in thousand) | 2025 | 2024 | % Change | ||||
Revenue | |||||||
Consumer Payments | $71,942 | $76,136 | (6%) | ||||
Business Payments | $10,988 | $9,677 | 14% | ||||
Elimination of intersegment revenues | ($5,605) | ($5,093) | |||||
Total revenue | $77,325 | $80,720 | (4%) | ||||
Gross profit (1) | |||||||
Consumer Payments | $56,709 | $59,591 | (5%) | ||||
Business Payments | $7,557 | $7,047 | 7% | ||||
Elimination of intersegment revenues | ($5,605) | ($5,093) | |||||
Total gross profit | $58,661 | $61,545 | (5%) | ||||
Total gross profit margin (2) | 76% | 76% |
(1) | Gross profit represents revenue less costs of services (exclusive of depreciation and amortization). |
(2) | Gross profit margin represents total gross profit / total revenue. |
Conference Call
REPAY will host a conference call to discuss first quarter financial results today, May 12, 2025 at 5:00 pm ET. Hosting the call will be John Morris, CEO, and Tim Murphy, CFO. The call will be webcast live from REPAY’s investor relations website at https://investors.repay.com/investor-relations. The conference call can also be accessed live over the phone by dialing (877) 407-3982, or for international callers (201) 493-6780. A replay will be available one hour after the call and can be accessed by dialing (844) 512-2921 or (412) 317-6671 for international callers; the conference ID is 13752562. The replay will be available at https://investors.repay.com/investor-relations.
Non-GAAP Financial Measures
This report includes certain non-GAAP financial measures that management uses to evaluate the Company’s operating business, measure performance, and make strategic decisions. Adjusted EBITDA is a non-GAAP financial measure that represents net income prior to interest expense, tax expense, depreciation and amortization, as adjusted to add back certain charges deemed to not be part of normal operating expenses, non-cash charges and/or non-recurring charges, such as gain on extinguishment of debt, non-cash change in fair value of assets and liabilities, share-based compensation charges, transaction expenses, restructuring and other strategic initiative costs and other non-recurring charges. Adjusted Net Income is a non-GAAP financial measure that represents net income prior to amortization of acquisition-related intangibles, as adjusted to add back certain charges deemed to not be part of normal operating expenses, such as non-cash change in fair value of assets and liabilities, share-based compensation expense, transaction expenses, restructuring and other strategic initiative costs, other non-recurring charges, non-cash interest expense and net of tax effect associated with these adjustments. Adjusted Net Income is adjusted to exclude amortization of all acquisition-related intangibles as such amounts are inconsistent in amount and frequency and are significantly impacted by the timing and/or size of acquisitions. Management believes that the adjustment of acquisition-related intangible amortization supplements GAAP financial measures because it allows for greater comparability of operating performance. Although REPAY excludes amortization from acquisition-related intangibles from its non-GAAP expenses, management believes that it is important for investors to understand that such intangibles were recorded as part of purchase accounting and contribute to revenue generation. Adjusted Net Income per share is a non-GAAP financial measure that represents Adjusted Net Income divided by the weighted average number of shares of Class A common stock outstanding (on an as-converted basis assuming conversion of the outstanding units exchangeable for shares of Class A common stock) for the three months ended March 31, 2025 and 2024 (excluding shares subject to forfeiture). Free Cash Flow is a non-GAAP financial measure that represents net cash flow provided by operating activities less total capital expenditures. Free Cash Flow Conversion represents Free Cash Flow divided by Adjusted EBITDA. Normalized gross profit growth represents year-over-year gross profit growth that excludes incremental gross profit attributable to political media spending associated with the 2024 election cycle in our media payments business. REPAY believes that Adjusted EBITDA, Adjusted Net Income, Adjusted Net Income per share, Free Cash Flow, Free Cash Flow Conversion and Normalized gross profit growth provide useful information to investors and others in understanding and evaluating its operating results in the same manner as management. However, these non-GAAP financial measures are not financial measures calculated in accordance with GAAP and should not be considered as a substitute for net income, operating profit, net cash provided by operating activities, or any other operating performance measure calculated in accordance with GAAP. Using these non-GAAP financial measures to analyze REPAY’s business has material limitations because the calculations are based on the subjective determination of management regarding the nature and classification of events and circumstances that investors may find significant. In addition, although other companies in REPAY’s industry may report measures titled as the same or similar measures, such non-GAAP financial measures may be calculated differently from how REPAY calculates its non-GAAP financial measures, which reduces their overall usefulness as comparative measures. Because of these limitations, you should consider REPAY’s non-GAAP financial measures alongside other financial performance measures, including net income, net cash provided by operating activities and REPAY’s other financial results presented in accordance with GAAP.
Forward-Looking Statements
This communication contains “forward-looking statements” within the meaning of the Private Securities Litigation Reform Act of 1995. Such statements include, but are not limited to, statements about future financial and operating results, including 2025 outlook, REPAY’s plans, objectives, expectations and intentions with respect to future operations, products and services; and other statements identified by words such as “guidance,” “will likely result,” “are expected to,” “will continue,” “should,” “is anticipated,” “estimated,” “believe,” “intend,” “plan,” “projection,” “outlook” or words of similar meaning. These forward-looking statements include, but are not limited to, statements regarding the strategic review process, REPAY’s market and growth opportunities, REPAY’s business strategy and the plans and objectives of management for future operations and the allocation of capital. Such forward-looking statements are based upon the current beliefs and expectations of REPAY’s management and are inherently subject to significant business, economic and competitive uncertainties and contingencies, many of which are difficult to predict and generally beyond REPAY’s control.
In addition to factors disclosed in REPAY’s reports filed with the U.S. Securities and Exchange Commission, including its Annual Report on Form 10-K for the year ended December 31, 2024 and those identified elsewhere in this communication, the following factors, among others, could cause actual results and the timing of events to differ materially from the anticipated results or other expectations expressed in the forward-looking statements: risks or uncertainties relating to the outcome or timing of REPAY’s strategic review process, exposure to economic conditions and political risk affecting the consumer loan market, the receivables management industry and consumer and commercial spending, including bank failures or other adverse events affecting financial institutions, inflationary pressures, evolving U.S. trade policies, general economic slowdown or recession; changes in the payment processing market in which REPAY competes, including with respect to its competitive landscape, technology evolution or regulatory changes; changes in the vertical markets that REPAY targets, including the regulatory environment applicable to REPAY’s clients; the ability to retain, develop and hire key personnel; risks relating to REPAY’s relationships within the payment ecosystem; risk that REPAY may not be able to execute its growth strategies, including identifying and executing acquisitions; risks relating to data security; changes in accounting policies applicable to REPAY; and the risk that REPAY may not be able to maintain effective internal controls.
Actual results, performance or achievements may differ materially, and potentially adversely, from any projections and forward-looking statements and the assumptions on which those forward-looking statements are based. There can be no assurance that the data contained herein is reflective of future performance to any degree. You are cautioned not to place undue reliance on forward-looking statements as a predictor of future performance. All information set forth herein speaks only as of the date hereof in the case of information about REPAY or the date of such information in the case of information from persons other than REPAY, and REPAY disclaims any intention or obligation to update any forward-looking statements as a result of developments occurring after the date of this communication. Forecasts and estimates regarding REPAY’s industry and end markets are based on sources it believes to be reliable, however there can be no assurance these forecasts and estimates will prove accurate in whole or in part. Pro forma, projected and estimated numbers are used for illustrative purpose only, are not forecasts and may not reflect actual results.
About REPAY
REPAY provides integrated payment processing solutions to verticals that have specific transaction processing needs. REPAY’s proprietary, integrated payment technology platform reduces the complexity of electronic payments for clients, while enhancing the overall experience for consumers and businesses.
Consolidated Statement of Operations | ||||||||||
Three Months Ended March 31, | ||||||||||
($ in thousands, except per share data) | 2025 | 2024 | ||||||||
Revenue | $77,325 | $80,720 | ||||||||
Operating expenses | ||||||||||
Costs of services (exclusive of depreciation and amortization shown separately below) | $18,664 | $19,175 | ||||||||
Selling, general and administrative | $36,987 | $37,021 | ||||||||
Depreciation and amortization | $25,294 | $27,028 | ||||||||
Total Operating Expenses | $80,945 | $83,224 | ||||||||
Loss from Operations | ($3,620) | ($2,504) | ||||||||
Other Income (Expense) | ||||||||||
Interest Income | $1,356 | $1,292 | ||||||||
Interest Expense | ($3,107) | ($912) | ||||||||
Change in fair value of tax receivable liability | ($3,022) | ($2,913) | ||||||||
Other income (loss), net | (227) | (26) | ||||||||
Total Other Income (Expense) | ($5,000) | ($2,559) | ||||||||
Loss Before Income Tax expense | ($8,620) | ($5,063) | ||||||||
Income Tax Benefit (Expense) | 452 | (302) | ||||||||
Net Loss | ($8,168) | ($5,365) | ||||||||
Net loss attributable to non-controlling interest | (221) | (153) | ||||||||
Net Loss Attributable to the Company | ($7,947) | ($5,212) | ||||||||
Weighted-average shares of Class A common stock outstanding - basic and diluted | 89,005,725 | 91,218,208 | ||||||||
Loss per Class A share - basic and diluted | ($0.09) | ($0.06) |
Consolidated Balance Sheets | ||||||||
($ in thousands) | March 31, 2025 (Unaudited) | December 31, 2024 | ||||||
Assets | ||||||||
Cash and cash equivalents | $165,466 | $189,530 | ||||||
Current restricted cash | $31,184 | $35,654 | ||||||
Accounts receivable | $36,831 | $32,950 | ||||||
Prepaid expenses and other | $16,646 | $17,114 | ||||||
Total current assets | $250,127 | $275,248 | ||||||
Property, plant and equipment, net | $1,778 | $2,383 | ||||||
Noncurrent restricted cash | $12,541 | $11,525 | ||||||
Intangible assets, net | $374,615 | $389,034 | ||||||
Goodwill | $716,793 | $716,793 | ||||||
Operating lease right-of-use assets, net | $10,713 | $11,142 | ||||||
Deferred tax assets | 163,846 | 163,283 | ||||||
Other assets | 4,979 | 2,500 | ||||||
Total noncurrent assets | $1,285,265 | $1,296,660 | ||||||
Total assets | $1,535,392 | $1,571,908 | ||||||
Liabilities | ||||||||
Accounts payable | $24,136 | $28,912 | ||||||
Accrued expenses | $41,573 | $55,501 | ||||||
Current operating lease liabilities | 1,266 | 1,230 | ||||||
Current tax receivable agreement ($0 and $2,413 held for related parties as of March 31, 2025 and December 31, 2024, respectively) | -- | 16,337 | ||||||
Other current liabilities | 457 | 267 | ||||||
Total current liabilities | $67,432 | $102,247 | ||||||
Long-term debt | $497,588 | $496,778 | ||||||
Noncurrent operating lease liabilities | 10,043 | 10,507 | ||||||
Tax receivable agreement, net of current portion ($25,518 and $25,134 held for related parties as of March 31, 2025 and December 31, 2024, respectively) | 190,441 | 187,308 | ||||||
Other liabilities | 2,690 | 1,899 | ||||||
Total noncurrent liabilities | $700,762 | $696,492 | ||||||
Total liabilities | $768,194 | $798,739 | ||||||
Commitments and contingencies | ||||||||
Stockholders' Equity | ||||||||
Class A common stock, $0.0001 par value; 2,000,000,000 shares authorized; 94,565,875 issued and 89,073,142 outstanding as of March 31, 2025 ; 93,732,227 issued and 88,239,494 outstanding as of December 31, 2024 | 9 | 9 | ||||||
Class V common stock, $0.0001 par value; 1,000 shares authorized and 100 shares issued and outstanding as of March 31, 2025 and December 31, 2024 | - | - | ||||||
Treasury stock, 5,492,733 as of March 31, 2025 and December 31, 2024 | (53,782) | (53,782) | ||||||
Additional paid-in capital | $1,151,265 | $1,148,871 | ||||||
Accumulated deficit | (341,773) | (333,826) | ||||||
Total REPAY stockholders’ equity | $755,719 | $761,272 | ||||||
Non-controlling interests | 11,479 | 11,897 | ||||||
Total equity | $767,198 | $773,169 | ||||||
Total liabilities and equity | $1,535,392 | $1,571,908 |
Consolidated Statements of Cash Flows | ||||||
Three Months Ended March 31, | ||||||
($ in thousands) | 2025 | 2024 | ||||
Cash flows from operating activities | ||||||
Net loss | ($8,168) | ($5,365) | ||||
Adjustments to reconcile net loss to net cash provided by operating activities: | ||||||
Depreciation and amortization | 25,294 | 27,028 | ||||
Stock-based compensation | 5,344 | 6,282 | ||||
Amortization of debt issuance costs | 810 | 712 | ||||
Other loss | 267 | — | ||||
Fair value change in tax receivable agreement liability | 3,022 | 2,913 | ||||
Deferred tax expense | (452) | 302 | ||||
Change in accounts receivable | (3,881) | (3,967) | ||||
Change in prepaid expenses and other | 468 | (520) | ||||
Change in operating lease ROU assets | 429 | 2,084 | ||||
Change in other assets | (2,479) | — | ||||
Change in accounts payable | (4,776) | 1,679 | ||||
Change in accrued expenses and other | (13,928) | (4,982) | ||||
Change in operating lease liabilities | (428) | (2,201) | ||||
Change in other liabilities | 981 | 836 | ||||
Net cash provided by operating activities | 2,503 | 24,801 | ||||
Cash flows from investing activities | ||||||
Purchases of property and equipment | (146) | (87) | ||||
Capitalized software development costs | (10,391) | (11,042) | ||||
Net cash used in investing activities | (10,537) | (11,129) | ||||
Cash flows from financing activities | ||||||
Payments for tax withholding related to shares vesting under Incentive Plan | (3,147) | (2,407) | ||||
Payment of Tax Receivable Agreement | (16,337) | (580) | ||||
Net cash used in financing activities | (19,484) | (2,987) | ||||
Increase in cash, cash equivalents and restricted cash | (27,518) | 10,685 | ||||
Cash, cash equivalents, and restricted cash at beginning of period | $236,709 | $144,145 | ||||
Cash, cash equivalents, and restricted cash at end of period | $209,191 | $154,830 | ||||
SUPPLEMENTAL DISCLOSURE OF CASH FLOW INFORMATION | ||||||
Cash paid during the year for: | ||||||
Interest | $4,525 | $200 | ||||
Income taxes (net of refunds received) | $(25) | $4 |
Reconciliation of GAAP Net Income (Loss) to Non-GAAP Adjusted EBITDA | ||||||
For the Three Months Ended March 31, 2025 and 2024 | ||||||
(Unaudited) | ||||||
Three Months Ended March 31, | ||||||
($ in thousands) | 2025 | 2024 | ||||
Revenue | $77,325 | $80,720 | ||||
Operating Expenses | ||||||
Costs of services (exclusive of depreciation and amortization shown separately below) | $18,664 | $19,175 | ||||
Selling, general and administrative | $36,987 | $37,021 | ||||
Depreciation and amortization | $25,294 | $27,028 | ||||
Total Operating Expenses | $80,945 | $83,224 | ||||
Loss from Operations | ($3,620) | ($2,504) | ||||
Other income (expense) | ||||||
Interest income | $1,356 | $1,292 | ||||
Interest expense | ($3,107) | ($912) | ||||
Change in fair value of tax receivable liability | ($3,022) | ($2,913) | ||||
Other Income (Loss), net | (227) | (26) | ||||
Total Other Income (Expense) | ($5,000) | ($2,559) | ||||
Loss Before Income Tax Expense | ($8,620) | ($5,063) | ||||
Income tax benefit (expense) | $452 | (302) | ||||
Net Loss | ($8,168) | ($5,365) | ||||
Add: | ||||||
Interest income | ($1,356) | ($1,292) | ||||
Interest expense | $3,107 | $912 | ||||
Depreciation and amortization(a) | $25,294 | $27,028 | ||||
Income tax benefit | ($452) | 302 | ||||
EBITDA | $18,425 | $21,585 | ||||
Non-cash change in fair value of assets and liabilities (b) | 3,022 | 2,913 | ||||
Share-based compensation expense(c) | $6,045 | $6,923 | ||||
Transaction expenses(d) | $782 | $677 | ||||
Restructuring and other strategic initiative costs(e) | 3,511 | $2,184 | ||||
Other non-recurring charges(f) | $1,390 | $1,231 | ||||
Adjusted EBITDA | $33,175 | $35,513 |
Quarterly Reconciliation of GAAP Net Income (Loss) to Non-GAAP Adjusted EBITDA | |||||||
(Unaudited) | |||||||
Three Months Ended | |||||||
($ in thousands) | June 30, 2024 | September 30, 2024 | December 31, 2024 | ||||
Net income (loss) | ($4,237) | $3,215 | (3,958) | ||||
Add: | |||||||
Interest income | ($1,463) | ($1,608) | $1,629 | ||||
Interest expense | 909 | 2,918 | 3,134 | ||||
Depreciation and amortization(a) | $26,771 | $25,529 | $24,382 | ||||
Income tax (benefit) expense | ($1,975) | $1,524 | (426) | ||||
EBITDA | $20,005 | $31,578 | $21,503 | ||||
Gain on extinguishment of debt(k) | — | ($13,136) | — | ||||
Non-cash change in fair value of assets and liabilities(b) | 3,366 | $6,479 | $1,785 | ||||
Share-based compensation expense(c) | $5,874 | $6,477 | $5,921 | ||||
Transaction expenses(d) | $414 | $937 | $297 | ||||
Restructuring and other strategic initiative costs(e) | $2,584 | $2,202 | $5,524 | ||||
Other non-recurring charges(f) | $1,485 | $562 | $1,440 | ||||
Adjusted EBITDA | $33,728 | $35,099 | $36,470 |
Reconciliation of GAAP Net Income (Loss) to Non-GAAP Adjusted Net Income | |||||
For the Three Months Ended March 31, 2025 and 2024 | |||||
(Unaudited) | |||||
Three Months Ended March 31, | |||||
($ in thousands) | 2025 | 2024 | |||
Revenue | $77,325 | $80,720 | |||
Operating expenses | |||||
Costs of services (exclusive of depreciation and amortization shown separately below) | $18,664 | $19,175 | |||
Selling, general, and administrative | $36,987 | $37,021 | |||
Depreciation and amortization | $25,294 | $27,028 | |||
Total operating expenses | $80,945 | $83,224 | |||
Loss from operations | ($3,620) | ($2,504) | |||
Interest income | $1,356 | $1,292 | |||
Interest expense | ($3,107) | ($912) | |||
Change in fair value of tax receivable liability | ($3,022) | ($2,913) | |||
Other income (loss), net | (227) | (26) | |||
Total other income (expense) | (5,000) | (2,559) | |||
Loss Before Income Tax Expense | (8,620) | (5,063) | |||
Income tax benefit (expense) | 452 | (302) | |||
Net loss | (8,168) | (5,365) | |||
Add | |||||
Amortization of acquisition-related intangibles(g) | 19,329 | 19,736 | |||
Non-cash change in fair value of assets and liabilities(b) | 3,022 | 2,913 | |||
Share-based compensation expense(c) | 6,045 | 6,923 | |||
Transaction expenses(d) | 782 | 677 | |||
Restructuring and other strategic initiative costs(e) | 3,511 | 2,184 | |||
Other non-recurring charges(f) | 1,390 | 1,231 | |||
Non-cash interest expense(h) | 845 | 712 | |||
Pro format taxes at effective rate(j) | (6,442) | (6,633) | |||
Adjusted Net Income | $20,314 | $22,378 | |||
Shares of Class A common stock outstanding (on an as-converted basis)(j) | 94,358,268 | 97,062,303 | |||
Adjusted Net Income per share | 0.22 | 0.23 |
Reconciliation of Operating Cash Flow to Free Cash Flow | |||||
For the Three Months and Years Ended December 31, 2024 and 2023
| |||||
(Unaudited) | |||||
Three Months Ended March 31, | |||||
($ in thousands) | 2025 | 2024 | |||
Net cash provided by operating activities | $2,503 | $24,801 | |||
Capital expenditures | |||||
Cash paid for property and equipment | (146) | (87) | |||
Capitalized software development costs | (10,391) | (11,042) | |||
Total capital expenditures | (10,537) | (11,129) | |||
Free cash flow | ($8,034) | ($13,672) | |||
Free cash flow conversion | (24%) | 38% |
Quarterly Reconciliation of Operating Cash Flow to Free Cash Flow | |||
(Unaudited) | |||
Three Months ended | |||
June 30, 2024 | September 30, 2024 | December 31, 2025 | |
(in $ thousands) | |||
Net cash provided by operating activities | $30,979 | $60,058 | $34,252 |
Capital expenditures | |||
Cash paid for property and equipment | (484) | (211) | (207) |
Capitalized software development costs | (11,207) | (11,029) | (10,586) |
Total capital expenditures | (11,691) | (11,240) | (10,793) |
Free cash flow | $19,288 | $48,818 | $23,459 |
Free cash flow conversion | 57% | 139% | 64% |
Reconciliation of Gross Profit Growth to Normalized Gross Profit Growth by Segment
| |||
For the Year-over-Year Change Between the Three Months Ended March 31, 2025 and 2024
| |||
(Unaudited)
| |||
Consumer Payments | Business Payments | Total | |
Gross profit growth | (5%) | 7% | (5%) |
Less: Growth from contributions related to political media | - | (5%) | (1%) |
Normalized gross profit growth (l) | (5%) | (12%) | (4%) |
(a) | See footnote (g) for details on amortization and depreciation expenses. | ||
(b) | Reflects the changes in management’s estimates of the fair value of the liability relating to the Tax Receivable Agreement. | ||
(c) | Represents compensation expense associated with equity compensation plans. | ||
(d) | Primarily consists of professional service fees incurred in connection with prior transactions. | ||
(e) | Reflects costs associated with reorganization of operations, consulting fees related to processing services and other operational improvements, including restructuring and integration activities related to acquired businesses, that were not in the ordinary course. | ||
(f) | For the three months ended March 31, 2025, the three months ended December 31, 2024, the three months ended September 30, 2024, the three months ended June 30, 2024 and the three months ended March 31, 2024, reflects franchise taxes and other non-income based taxes, non-recurring legal and other litigation expenses and payments made to third-parties in connection with our IT security and personnel. | ||
(g) | Reflects amortization of client relationships, non-compete agreement, software, and channel relationship intangibles acquired through the business combination with Thunder Bridge, and client relationships, non-compete agreement, and software intangibles acquired through REPAY's acquisitions of TriSource Solutions, APS Payments, Ventanex, cPayPlus, CPS Payments, BillingTree, Kontrol Payables and Payix. This adjustment excludes the amortization of other intangible assets which were acquired in the regular course of business, such as capitalized internally developed software and purchased software. See additional information below for an analysis of amortization expenses: |
Three months ended March 31, | ||
($ in thousands) | 2025 | 2024 |
Acquisition-related intangibles | $19,329 | $19,736 |
Software | $5,482 | $6,713 |
Amortization | $24,811 | $26,449 |
Depreciation | $483 | $579 |
Total Depreciation and Amortization (1) | $25,294 | $27,028 |
Three Months Ended | |||
(in $ thousands) | June 30, 2024 | September 20, 2024 | December 31, 2024 |
Acquisition-related intangibles | $19,702 | $19,111 | $18,595 |
Software | $6,856 | $6,008 | $5,249 |
Amortization | $26,558 | $25,119 | $23,844 |
Depreciation | $213 | $410 | $538 |
Total Depreciation and Amortization (1) | $26,771 | $25,529 | $24,382 |
(1) | Adjusted Net Income is adjusted to exclude amortization of all acquisition-related intangibles as such amounts are inconsistent in amount and frequency and are significantly impacted by the timing and/or size of acquisitions (see corresponding adjustments in the reconciliation of net income to Adjusted Net Income presented above). Management believes that the adjustment of acquisition-related intangible amortization supplements GAAP financial measures because it allows for greater comparability of operating performance. Although REPAY excludes amortization from acquisition-related intangibles from its non-GAAP expenses, management believes that it is important for investors to understand that such intangibles were recorded as part of purchase accounting and contribute to revenue generation. Amortization of intangibles that relate to past acquisitions will recur in future periods until such intangibles have been fully amortized. Any future acquisitions may result in the amortization of additional intangibles. | |
(h) | Represents amortization of non-cash deferred debt issuance costs. | |
(i) | Represents pro forma income tax adjustment effect associated with items adjusted above. | |
(j) | Represents the weighted average number of shares of Class A common stock outstanding (on an as-converted basis assuming conversion of outstanding Post-Merger REPAY Units) for the three months ended March 31, 2025 and 2024. These numbers do not include any shares issuable upon conversion of the Company’s convertible senior notes. See the reconciliation of basic weighted average shares outstanding to the non-GAAP Class A common stock outstanding on an as-converted basis for each respective period below: |
Three Months Ended March 31, | ||
2025 | 2024 | |
Weighted average shares of Class A common stock outstanding - basic | 89,005,725 | 91,218,208 |
Add: Non-controlling interests | ||
Weighted average Post-Merger REPAY Units exchangeable for Class A common stock | 5,352,543 | 5,844,095 |
Shares of Class A common stock outstanding (on an as-converted basis) | 94,358,268 | 97,062,303 |
(k) | Reflects a gain on the repurchase of 2026 Notes principal, net of a write-off of debt issuance costs relating to the repurchased principal. | ||
(l) | Represents year-over-year gross profit growth that excludes incremental gross profit attributable to political media spending in Q1 2024 associated with the 2024 election cycle in our media payments business. |
View source version on businesswire.com:
https://www.businesswire.com/news/home/20250512344859/en
Investor Relations Contact for REPAY:
ir@repay.com
Media Relations Contact for REPAY:
Kristen Hoyman
(404) 637-1665
khoyman@repay.com
Source: Repay Holdings Corporation
ATLANTA--(BUSINESS WIRE)--Apr. 25, 2025-- Repay Holdings Corporation (NASDAQ: RPAY) (“REPAY” or the “Company”), a leading provider of vertically-integrated payment solutions, today announced that the Company will host a conference call to discuss first quarter 2025 financial results on Monday, May 12, 2025 at 5:00pm ET. A press release with first quarter 2025 financial results will be issued after the market closes that same day.
The conference call will be webcast live from the Company's investor relations website at https://investors.repay.com/ under the “Events” section. The conference call can also be accessed live over the phone by dialing (877) 407-3982, or for international callers (201) 493-6780. A replay will be available two hours after the call and can be accessed by dialing (844) 512-2921 or (412) 317-6671 for international callers; the conference ID is 13752562. The replay will be available until Monday, May 26, 2025. An archive of the webcast will be available at the same location on the website shortly after the call has concluded.
About REPAY
REPAY provides integrated payment processing solutions to verticals that have specific transaction processing needs. REPAY’s proprietary, integrated payment technology platform reduces the complexity of electronic payments for clients, while enhancing the overall experience for consumers and businesses.
View source version on businesswire.com: https://www.businesswire.com/news/home/20250425700844/en/
Investor Relations Contact for REPAY:
ir@repay.com
Media Relations Contact for REPAY:
Kristen Hoyman
khoyman@repay.com
Source: Repay Holdings Corporation
At REPAY, innovation is a promise we deliver on every day. That’s why we’re proud to share that MortgagePoint has named REPAY a 2025 MortgagePoint Tech Excellence Award recipient, recognizing our best-in-class digital payment technology tailored specifically for mortgage servicing.
This recognition reinforces our commitment to helping mortgage servicers streamline operations, simplify compliance and elevate the borrower experience through seamless, secure and scalable payment solutions.
A Trusted Name in Mortgage Technology
The MortgagePoint Tech Excellence Awards spotlight companies that are driving meaningful change across the mortgage ecosystem. Our selection as an award recipient highlights the impact of our end-to-end payment technology engineered to meet the demands of today’s mortgage servicers and their borrowers.
With realtime processing, flexible payment options and robust integrations, REPAY helps servicers increase efficiency, improve borrower satisfaction and maintain compliance, all from a single, easy-to-implement platform.
We’re also interested in what’s driving innovation across the mortgage servicing landscape. Read about the benefits of integrated, omni-channel digital payment solutions in our white paper, The Future of Mortgage Payment Is Digital.
Purpose-Built for the Mortgage Industry
The REPAY mortgage payment platform is designed to solve the challenges servicers face every day. From managing high call volumes and reducing delinquency rates to meeting evolving consumer expectations, our technology makes it easier to:
- Accept payments anytime, anywhere with options for web, mobile, IVR, text and agent-assisted channels
- Automate communications and reminders to reduce manual outreach
- Maintain PCI compliance and mitigate fraud risk through tokenization and secure workflows
- Integrate seamlessly with leading loan servicing systems
This award is a reflection of our continued investment in payment technology that empowers mortgage servicers to deliver better outcomes both operationally and for the borrowers they serve.
Proven Innovation Across Consumer Payments
While the MortgagePoint Tech Excellence Award highlights our leadership in mortgage, it’s also part of a larger story. Our payment technology supports thousands of businesses across lending, auto finance, healthcare and other consumer-facing verticals. No matter who we support, the focus remains the same: delivering flexible, secure and integrated solutions that simplify payments at scale.
Our recognition in mortgage adds to a growing list of industry validations that underscore our commitment to technology excellence across every vertical we serve.
“This award reflects the innovation that we’ve built into every layer of our mortgage payments platform,” says Jeff Osheka, SVP, Mortgage Vertical Leader, REPAY. “Servicers today need technology that makes them more efficient without sacrificing compliance or the borrower experience — and that’s exactly what REPAY is here to provide.”
Moving Mortgage Payments Forward
For mortgage servicers, this award is both a badge of recognition and further proof that REPAY is a trusted technology partner committed to solving industry challenges with precision and foresight.
- Trust and reliability in a partner with proven success across mortgage and other highly regulated industries
- Ongoing innovation driven by deep industry expertise and a commitment to compliance and security
- Seamless borrower experiences powered by realtime processing, flexible payment options and easy-to-use digital channels
REPAY is proud to be recognized as a technology leader in mortgage servicing. We’re even more proud to support the servicers who keep the industry moving forward. Our mission is to simplify payments, reduce friction and enable better borrower experiences at every step.
To learn more about the MortgagePoint Tech Excellence Awards, read their full announcement. Contact our team today to learn more about how REPAY can help you modernize your payment experience!
March 3, 2025.
Gross Profit Growth of 2% in Q4 and 6% Full Year 2024
Strong Adjusted EBITDA Growth and Accelerated Free Cash Flow Conversion during 2024
Announces Strategic Review Process, including Potential Strategic Alternatives
ATLANTA--(BUSINESS WIRE)--Mar. 3, 2025-- Repay Holdings Corporation (NASDAQ: RPAY) (“REPAY” or the “Company”), a leading provider of vertically-integrated payment solutions, today reported financial results for its fourth quarter and full year ended December 31, 2024.
Fourth Quarter 2024 Financial Highlights
($ in millions) | Q4 2023 | Q1 2024 | Q2 2024 | Q3 2024 | Q4 2024 | YoY Change | |||||||
Revenue | $76.0 | $80.7 | $74.9 | $79.1 | $78.3 | 3% | |||||||
Gross profit (1) | 58.7 | 61.5 | 58.6 | 61.6 | 59.7 | 2% | |||||||
Net (loss) income (2) | (77.7) | (5.4) | (4.2) | 3.2 | (4.0) | – | |||||||
Adjusted EBITDA (3) | 33.5 | 35.5 | 33.7 | 35.1 | 36.5 | 9% | |||||||
Net cash provided by operating activities | 34.9 | 24.8 | 31.0 | 60.1 | 34.3 | (2%) | |||||||
Free Cash Flow (3) | 21.8 | 13.7 | 19.3 | 48.8 | 23.5 | 8% | |||||||
Free Cash Flow Conversion (3) | 65% | 38% | 57% | 139% | 64% |
(1) | Gross profit represents revenue less costs of services (exclusive of depreciation and amortization). |
(2) | During the fourth quarter of 2023, Net loss was impacted by a $75.7 million goodwill impairment loss. Further information about this non-cash impairment loss can be found in our Annual Report on Form 10-K for the year ended December 31, 2024. |
(3) | Adjusted EBITDA, Free Cash Flow and Free Cash Flow Conversion are non-GAAP financial measures. See “Non-GAAP Financial Measures” and the reconciliation of Adjusted EBITDA, Free Cash Flow and Free Cash Flow Conversion to their most comparable GAAP measure provided below for additional information. |
“Q4 closed out the year with another quarter of profitable growth at REPAY,” said John Morris, CEO of REPAY. “Our full year results showcased our resilient business model with strong double digit Adjusted EBITDA growth and accelerating Free Cash Flow Conversion from 42% in 2023 to 75% in 2024. As we reflect on the accomplishments we achieved in 2024 and turn to 2025, we remain dedicated to delivering the best payment experience for our clients and creating value by facilitating the ongoing secular shift to more digital payment flows.
REPAY has built our technology platform to scale both organically and inorganically, with the potential to benefit from additional opportunities ahead. With the Board’s support, we have commenced a comprehensive strategic review, with the assistance of outside advisors, to assess a full range of alternatives aimed at capturing shareholder value. The review includes evaluating opportunities to further strengthen REPAY’s position in the verticals we serve, adjacent end markets, GTM strategy, relationships with our partners, and capital allocation. This strategic review may also include consideration of various strategic alternatives, including M&A, a sale or take private of the Company and other structural changes, transactions and alternatives that could enhance shareholder value.”
REPAY has not set a deadline for the completion of the review process, and there can be no assurance that the strategic review will result in any particular outcome, transaction, or other strategic alternative. REPAY does not intend to comment further or provide updates regarding the strategic review until it has been completed, unless the Company determines that additional disclosure is appropriate or required by law.
Fourth Quarter 2024 Business Highlights
The Company's achievements in the quarter, including those highlighted below, reinforce management's belief in the ability of the Company to drive durable and sustained growth across REPAY's diversified business model.
- 2% year-over-year gross profit growth in Q4
- Consumer Payments gross profit declined approximately 5% year-over-year which was partially impacted from clients rolling off during the fourth quarter
- Business Payments gross profit growth of approximately 60% year-over-year as we benefited from strong contributions in our political media vertical
- Accelerated AP supplier network to over 360,000, an increase of approximately 38% year-over-year
- Added four new integrated software partners to bring the total to 280 software relationships as of the end of the fourth quarter
- Instant funding volumes increased by approximately 34% year-over-year
- Added 16 new credit unions bringing total credit union clients to 329
Segments
The Company reports its financial results based on two reportable segments.
Consumer Payments –The Consumer Payments segment provides payment processing solutions (including debit and credit card processing, Automated Clearing House (“ACH”) processing and other electronic payment acceptance solutions, as well as REPAY’s loan disbursement product) that enable REPAY’S clients to collect payments from and disburse funds to consumers and includes its clearing and settlement solutions (“RCS”). RCS is REPAY’s proprietary clearing and settlement platform through which it markets customizable payment processing programs to other ISOs and payment facilitators. The strategic vertical markets served by the Consumer Payments segment primarily include personal loans, automotive loans, receivables management, credit unions, mortgage servicing, consumer healthcare and diversified retail.
Business Payments –The Business Payments segment provides payment processing solutions (including accounts payable automation, debit and credit card processing, virtual credit card processing, ACH processing and other electronic payment acceptance solutions) that enable REPAY’s clients to collect payments from or send payments to other businesses. The strategic vertical markets served within the Business Payments segment primarily include retail automotive, education, field services, governments and municipalities, healthcare, media, homeowner association management and hospitality.
Segment Revenue, Gross Profit, and Gross Profit Margin
Three Months Ended December 31, | Year Ended December 31, | ||||||||||||
($ in thousand) | 2024 (Unaudited) | 2023 (Unaudited) | % Change | 2024 | 2023 | % Change | |||||||
Revenue | |||||||||||||
Consumer Payments | $66,349 | $71,124 | (7%) | $280,966 | $275,708 | 2% | |||||||
Business Payments | $17,357 | $9,850 | 76% | $52,923 | $38,058 | 39% | |||||||
Elimination of intersegment revenues | ($5,435) | ($4,987) | ($20,847) | ($17,139) | |||||||||
Total revenue | $78,271 | $75,987 | 3% | $313,042 | $296,627 | 6% | |||||||
Gross profit (1) | |||||||||||||
Consumer Payments | $53,081 | $56,168 | (5%) | $223,107 | $216,096 | 3% | |||||||
Business Payments | $12,069 | $7,545 | 60% | $39,146 | $27,967 | 40% | |||||||
Elimination of intersegment revenues | ($5,435) | ($4,987) | ($20,847) | ($17,139) | |||||||||
Total gross profit | $59,715 | $58,726 | 2% | $241,406 | $226,924 | 6% | |||||||
Total gross profit margin (2) | 76% | 77% | 77% | 77% |
(1) | Gross profit represents revenue less costs of services (exclusive of depreciation and amortization). |
(2) | Gross profit margin represents total gross profit / total revenue. |
Conference Call
REPAY will host a conference call to discuss fourth quarter and full year 2024 financial results today, March 3, 2025 at 5:00 pm ET. Hosting the call will be John Morris, CEO, and Tim Murphy, CFO. The call will be webcast live from REPAY’s investor relations website at https://investors.repay.com/investor-relations. The conference call can also be accessed live over the phone by dialing (877) 407-3982, or for international callers (201) 493-6780. A replay will be available one hour after the call and can be accessed by dialing (844) 512-2921 or (412) 317-6671 for international callers; the conference ID is 13750988. The replay will be available at https://investors.repay.com/investor-relations.
Non-GAAP Financial Measures
This report includes certain non-GAAP financial measures that management uses to evaluate the Company’s operating business, measure performance, and make strategic decisions. Adjusted EBITDA is a non-GAAP financial measure that represents net income prior to interest expense, tax expense, depreciation and amortization, as adjusted to add back certain charges deemed to not be part of normal operating expenses, non-cash charges and/or non-recurring charges, such as loss on business disposition, gain on extinguishment of debt, non-cash change in fair value of contingent consideration, non-cash impairment loss, non-cash change in fair value of assets and liabilities, share-based compensation charges, transaction expenses, restructuring and other strategic initiative costs and other non-recurring charges. Adjusted Net Income is a non-GAAP financial measure that represents net income prior to amortization of acquisition-related intangibles, as adjusted to add back certain charges deemed to not be part of normal operating expenses, such as loss on business disposition, gain on extinguishment of debt, non-cash change in fair value of contingent consideration, non-cash impairment loss, non-cash change in fair value of assets and liabilities, share-based compensation expense, transaction expenses, restructuring and other strategic initiative costs, other non-recurring charges, non-cash interest expense and net of tax effect associated with these adjustments. Adjusted Net Income is adjusted to exclude amortization of all acquisition-related intangibles as such amounts are inconsistent in amount and frequency and are significantly impacted by the timing and/or size of acquisitions. Management believes that the adjustment of acquisition-related intangible amortization supplements GAAP financial measures because it allows for greater comparability of operating performance. Although REPAY excludes amortization from acquisition-related intangibles from its non-GAAP expenses, management believes that it is important for investors to understand that such intangibles were recorded as part of purchase accounting and contribute to revenue generation. Adjusted Net Income per share is a non-GAAP financial measure that represents Adjusted Net Income divided by the weighted average number of shares of Class A common stock outstanding (on an as-converted basis assuming conversion of the outstanding units exchangeable for shares of Class A common stock) for the three months and years ended December 31, 2024 and 2023 (excluding shares subject to forfeiture). Free Cash Flow is a non-GAAP financial measure that represents net cash flow provided by operating activities less total capital expenditures. Free Cash Flow Conversion represents Free Cash Flow divided by Adjusted EBITDA. REPAY believes that Adjusted EBITDA, Adjusted Net Income, Adjusted Net Income per share, Free Cash Flow and Free Cash Flow Conversion provide useful information to investors and others in understanding and evaluating its operating results in the same manner as management. However, these non-GAAP financial measures are not financial measures calculated in accordance with GAAP and should not be considered as a substitute for net income, operating profit, net cash provided by operating activities, or any other operating performance measure calculated in accordance with GAAP. Using these non-GAAP financial measures to analyze REPAY’s business has material limitations because the calculations are based on the subjective determination of management regarding the nature and classification of events and circumstances that investors may find significant. In addition, although other companies in REPAY’s industry may report measures titled as the same or similar measures, such non-GAAP financial measures may be calculated differently from how REPAY calculates its non-GAAP financial measures, which reduces their overall usefulness as comparative measures. Because of these limitations, you should consider REPAY’s non-GAAP financial measures alongside other financial performance measures, including net income, net cash provided by operating activities and REPAY’s other financial results presented in accordance with GAAP.
Forward-Looking Statements
This communication contains “forward-looking statements” within the meaning of the Private Securities Litigation Reform Act of 1995. Such statements include, but are not limited to, statements about future financial and operating results, REPAY’s plans, objectives, expectations and intentions with respect to future operations, products and services; and other statements identified by words such as “guidance,” “will likely result,” “are expected to,” “will continue,” “should,” “is anticipated,” “estimated,” “believe,” “intend,” “plan,” “projection,” “outlook” or words of similar meaning. These forward-looking statements include, but are not limited to, statements regarding the strategic review process, REPAY’s market and growth opportunities, REPAY’s business strategy and the plans and objectives of management for future operations and the allocation of capital. Such forward-looking statements are based upon the current beliefs and expectations of REPAY’s management and are inherently subject to significant business, economic and competitive uncertainties and contingencies, many of which are difficult to predict and generally beyond REPAY’s control.
In addition to factors disclosed in REPAY’s reports filed with the U.S. Securities and Exchange Commission, including its Annual Report on Form 10-K for the year ended December 31, 2024 and those identified elsewhere in this communication, the following factors, among others, could cause actual results and the timing of events to differ materially from the anticipated results or other expectations expressed in the forward-looking statements: risks or uncertainties relating to the outcome or timing of REPAY’s strategic review process, exposure to economic conditions and political risk affecting the consumer loan market, the receivables management industry and consumer and commercial spending, including bank failures or other adverse events affecting financial institutions, inflationary pressures, general economic slowdown or recession; changes in the payment processing market in which REPAY competes, including with respect to its competitive landscape, technology evolution or regulatory changes; changes in the vertical markets that REPAY targets, including the regulatory environment applicable to REPAY’s clients; the ability to retain, develop and hire key personnel; risks relating to REPAY’s relationships within the payment ecosystem; risk that REPAY may not be able to execute its growth strategies, including identifying and executing acquisitions; risks relating to data security; changes in accounting policies applicable to REPAY; and the risk that REPAY may not be able to maintain effective internal controls.
Actual results, performance or achievements may differ materially, and potentially adversely, from any projections and forward-looking statements and the assumptions on which those forward-looking statements are based. There can be no assurance that the data contained herein is reflective of future performance to any degree. You are cautioned not to place undue reliance on forward-looking statements as a predictor of future performance. All information set forth herein speaks only as of the date hereof in the case of information about REPAY or the date of such information in the case of information from persons other than REPAY, and REPAY disclaims any intention or obligation to update any forward-looking statements as a result of developments occurring after the date of this communication. Forecasts and estimates regarding REPAY’s industry and end markets are based on sources it believes to be reliable, however there can be no assurance these forecasts and estimates will prove accurate in whole or in part. Pro forma, projected and estimated numbers are used for illustrative purpose only, are not forecasts and may not reflect actual results.
About REPAY
REPAY provides integrated payment processing solutions to verticals that have specific transaction processing needs. REPAY’s proprietary, integrated payment technology platform reduces the complexity of electronic payments for clients, while enhancing the overall experience for consumers and businesses.
Consolidated Statement of Operations | ||||||||||||||||||
Three Months Ended December 31, | Year Ended December 31, | |||||||||||||||||
($ in thousands, except per share data) | 2024 (Unaudited) | 2023 (Unaudited) | 2024 | 2023 | ||||||||||||||
Revenue | $78,271 | $75,987 | $313,042 | $296,627 | ||||||||||||||
Operating expenses | ||||||||||||||||||
Costs of services (exclusive of depreciation and amortization) | $18,556 | $17,261 | $71,636 | $69,703 | ||||||||||||||
Selling, general and administrative | $36,503 | $36,679 | $145,466 | $148,653 | ||||||||||||||
Depreciation and amortization | $24,382 | $24,711 | $103,710 | $103,857 | ||||||||||||||
Loss on business disposition | — | — | — | $10,027 | ||||||||||||||
Impairment loss | — | $75,750 | — | $75,800 | ||||||||||||||
Total Operating Expenses | $79,441 | $154,401 | $320,812 | $408,040 | ||||||||||||||
Loss from Operations | ($1,170) | ($78,414) | ($7,770) | ($111,413) | ||||||||||||||
Other Income (Expense) | ||||||||||||||||||
Interest Income | $1,629 | $1,260 | $5,992 | $2,822 | ||||||||||||||
Interest Expense | ($3,134) | ($895) | ($7,873) | ($3,870) | ||||||||||||||
Gain on extinguishment of debt | — | — | $13,136 | — | ||||||||||||||
Change in fair value of tax receivable liability | ($1,785) | ($2,903) | ($14,543) | ($6,619) | ||||||||||||||
Other income (loss) | $76 | ($145) | $138 | ($455) | ||||||||||||||
Total Other Income (Expense) | ($3,214) | ($2,683) | ($3,150) | ($8,122) | ||||||||||||||
Income (Loss) Before Income Tax | ($4,384) | ($81,097) | ($10,920) | ($119,535) | ||||||||||||||
Income Tax Benefit (Expense) | 426 | 3,423 | 575 | 2,115 | ||||||||||||||
Net Income (Loss) | ($3,958) | ($77,674) | ($10,345) | ($117,420) | ||||||||||||||
Net loss attributable to non-controlling interest | 158 | ($4,387) | ($189) | ($6,930) | ||||||||||||||
Net Income (Loss) Attributable to the Company | ($4,116) | ($73,287) | ($10,156) | ($110,490) | ||||||||||||||
Weighted-Average Shares of Class A Common Stock Outstanding - Basic | 88,392,571 | 91,206,870 | 89,915,137 | 90,048,638 | ||||||||||||||
Weighted-Average Shares of Class A Common Stock Outstanding - Diluted | 88,392,571 | 91,206,870 | 89,915,137 | 90,048,638 | ||||||||||||||
Income (Loss) per Class A Share - Basic | ($0.05) | ($0.80) | ($0.11) | ($1.23) | ||||||||||||||
Income (Loss) per Class A Share - Diluted | ($0.05) | ($0.80) | ($0.11) | ($1.23) |
Consolidated Balance Sheets | ||||||||
December 31, 2024 | December 31, 2023 | |||||||
($ in thousands) | ||||||||
Assets | ||||||||
Cash and cash equivalents | $189,530 | $118,096 | ||||||
Current restricted cash | $35,654 | $11,324 | ||||||
Accounts receivable, net | $32,950 | $36,017 | ||||||
Prepaid expenses and other | $17,114 | $15,209 | ||||||
Total current assets | $275,248 | $180,646 | ||||||
Property and equipment, net | $2,383 | $3,133 | ||||||
Noncurrent restricted cash | $11,525 | $14,725 | ||||||
Intangible assets, net | $389,034 | $447,141 | ||||||
Goodwill | $716,793 | $716,793 | ||||||
Operating lease right-of-use assets, net | $11,142 | $8,023 | ||||||
Deferred tax assets | 163,283 | 146,872 | ||||||
Other assets | 2,500 | 2,500 | ||||||
Total noncurrent assets | $1,296,660 | $1,339,187 | ||||||
Total assets | $1,571,908 | $1,519,833 | ||||||
Liabilities | ||||||||
Accounts payable | $28,912 | $22,030 | ||||||
Accrued expenses | $55,501 | $32,906 | ||||||
Current operating lease liabilities | 1,230 | 1,629 | ||||||
Current tax receivable agreement ($2,413 and $68 held for related parties as of December 31, 2024 and December 31, 2023, respectively) | 16,337 | 580 | ||||||
Other current liabilities | 267 | 318 | ||||||
Total current liabilities | $102,247 | $57,463 | ||||||
Long-term debt | $496,778 | $434,166 | ||||||
Noncurrent operating lease liabilities | 10,507 | 7,247 | ||||||
Tax receivable agreement, net of current portion ($25,134 and $25,348 held for related parties as of December 31, 2024 and December 31, 2023, respectively) | 187,308 | 188,331 | ||||||
Other liabilities | 1,899 | 1,838 | ||||||
Total noncurrent liabilities | $696,492 | $631,582 | ||||||
Total liabilities | $798,739 | $689,045 | ||||||
Commitments and contingencies | ||||||||
Stockholders' Equity | ||||||||
Class A common stock, $0.0001 par value; 2,000,000,000 shares authorized, 93,732,227 issued and 88,239,494 outstanding as of December 31, 2024; 92,220,494 issued and 90,803,984 outstanding as of December 31, 2023 | 9 | 9 | ||||||
Class V common stock, $0.0001 par value; 1,000 shares authorized and 100 shares issued and outstanding as of December 31, 2024 and 2023 | - | - | ||||||
Treasury stock, 1,416,510 and 1,416,510 shares as of December 31, 2024 and December 31, 2023, respectively | (53,782) | (12,528) | ||||||
Additional paid-in capital | $1,148,871 | $1,151,324 | ||||||
Accumulated deficit | ($333,826) | ($323,670) | ||||||
Total REPAY stockholders’ equity | $761,272 | $815,135 | ||||||
Non-controlling interests | 11,897 | 15,653 | ||||||
Total equity | $773,169 | $830,788 | ||||||
Total liabilities and equity | $1,571,908 | $1,519,833 |
Consolidated Statements of Cash Flows | ||||||
Year Ended December 31, | ||||||
($ in thousands) | 2024 | 2023 | ||||
Cash flows from operating activities | ||||||
Net income (loss) | ($10,345) | ($117,420) | ||||
Adjustments to reconcile net income (loss) to net cash provided by operating activities: | ||||||
Depreciation and amortization | 103,710 | 103,857 | ||||
Stock-based compensation | 24,388 | 22,156 | ||||
Amortization of debt issuance costs | 3,030 | 2,847 | ||||
Loss on business disposition | — | 10,027 | ||||
Gain on extinguishment of debt | ($13,136) | — | ||||
Other loss | — | 238 | ||||
Fair value change in tax receivable agreement liability | 14,543 | 6,619 | ||||
Impairment loss | — | 78,800 | ||||
Deferred tax expense (benefit) | (2,490) | (3,594) | ||||
Change in accounts receivable, net | 3,067 | (3,986) | ||||
Change in prepaid expenses and other | (1,905) | 2,936 | ||||
Change in operating lease ROU assets | (3,119) | 1,328 | ||||
Change in accounts payable | 6,882 | (189) | ||||
Change in accrued expenses and other | 22,594 | 3,890 | ||||
Change in operating lease liabilities | 2,861 | (1,388) | ||||
Change in other liabilities | 10 | 493 | ||||
Net cash provided by operating activities | 150,090 | 103,614 | ||||
Cash flows from investing activities | ||||||
Purchases of property and equipment | ($989) | ($733) | ||||
Purchases of intangible assets | — | (13,545) | ||||
Capitalized software development costs | ($43,864) | ($50,083) | ||||
Proceeds from sale of business, net of cash retained | — | 40,273 | ||||
Net cash used in investing activities | ($44,853) | ($24,088) | ||||
Cash flows from financing activities | ||||||
Issuance of long-term debt | 287,500 | — | ||||
Payments on long-term debt | ($205,150) | ($20,000) | ||||
Payments of debt issuance costs | (9,631) | — | ||||
Payments for tax withholding related to shares vesting under Incentive Plan and ESPP | (2,131) | (1,891) | ||||
Treasury shares repurchased | (41,541) | (2,528) | ||||
Stock options exercised | 395 | — | ||||
Distributions to Members | (2,349) | (3,525) | ||||
Purchase of capped calls related to issuance of the 2029 Notes | (39,186) | — | ||||
Payment of Tax Receivable Agreement (“TRA”) | (580) | — | ||||
Payments of contingent consideration up to acquisition date fair value | — | (1,000) | ||||
Net cash used in financing activities | (12,673) | (28,944) | ||||
Increase in cash, cash equivalents and restricted cash | 92,564 | 50,582 | ||||
Cash, cash equivalents, and restricted cash at beginning of period | $144,145 | $93,563 | ||||
Cash, cash equivalents, and restricted cash at end of period | $236,709 | $144,145 | ||||
SUPPLEMENTAL DISCLOSURE OF CASH FLOW INFORMATION | ||||||
Cash paid during the year for: | ||||||
Interest | $4,843 | $1,024 | ||||
Income taxes | $2,811 | $1,330 |
Reconciliation of GAAP Net Income (Loss) to Non-GAAP Adjusted EBITDA | ||||||
For the Three Months Ended December 31, 2024 and 2023 | ||||||
(Unaudited) | ||||||
Three Months Ended December 31, | ||||||
($ in thousands) | 2024 | 2023 | ||||
Revenue | $78,271 | $75,987 | ||||
Operating Expenses | ||||||
Costs of services (exclusive of depreciation and amortization) | $18,556 | $17,261 | ||||
Selling, general and administrative | $36,503 | $36,679 | ||||
Depreciation and amortization | $24,382 | $24,711 | ||||
Impairment loss | — | $75,750 | ||||
Total Operating Expenses | $79,441 | $154,401 | ||||
Loss from Operations | ($1,170) | ($78,414) | ||||
Other income (expense) | ||||||
Interest income | $1,629 | $1,260 | ||||
Interest expense | ($3,134) | ($895) | ||||
Change in fair value of tax receivable liability | ($1,785) | ($2,903) | ||||
Other Income (Loss) | 76 | (145) | ||||
Total Other Income (Expense) | ($3,214) | ($2,683) | ||||
Income (Loss) Before Income Tax Benefit (Expense) | ($4,384) | ($81,097) | ||||
Income tax benefit (expense) | $426 | $3,423 | ||||
Net Income (Loss) | ($3,958) | ($77,674) | ||||
Add: | ||||||
Interest income | ($1,629) | ($1,260) | ||||
Interest expense | $3,134 | $895 | ||||
Depreciation and amortization(a) | $24,382 | $24,711 | ||||
Income tax benefit (expense) | ($426) | ($3,423) | ||||
EBITDA | $21,503 | ($56,751) | ||||
Non-cash impairment loss(b) | — | $75,750 | ||||
Non-cash change in fair value of assets and liabilities(c) | $1,785 | $3,778 | ||||
Share-based compensation expense(d) | $5,921 | $5,899 | ||||
Transaction expenses(e) | $297 | $921 | ||||
Restructuring and other strategic initiative costs(f) | $5,524 | $3,372 | ||||
Other non-recurring charges(g) | $1,440 | $520 | ||||
Adjusted EBITDA | $36,470 | $33,489 |
Quarterly Reconciliation of GAAP Net Income (Loss) to Non-GAAP Adjusted EBITDA | |||||||
(Unaudited) | |||||||
Three Months Ended | |||||||
($ in thousands) | March 31, 2024 | June 30, 2024 | September 30, 2024 | ||||
Net income (loss) | ($5,365) | ($4,237) | $3,215 | ||||
Add: | |||||||
Interest expense (income), net | ($380) | ($554) | $1,310 | ||||
Depreciation and amortization(a) | $27,028 | $26,771 | $25,529 | ||||
Income tax (benefit) expense | $302 | ($1,975) | $1,524 | ||||
EBITDA | $21,585 | $20,005 | $31,578 | ||||
Gain on extinguishment of debt(i) | — | — | ($13,136) | ||||
Non-cash change in fair value of assets and liabilities(c) | $2,913 | $3,366 | $6,479 | ||||
Share-based compensation expense(d) | $6,923 | $5,874 | $6,477 | ||||
Transaction expenses(e) | $677 | $414 | $937 | ||||
Restructuring and other strategic initiative costs(f) | $2,184 | $2,584 | $2,202 | ||||
Other non-recurring charges(g) | $1,231 | $1,485 | $562 | ||||
Adjusted EBITDA | $35,513 | $33,728 | $35,099 |
Reconciliation of GAAP Net Income (Loss) to Non-GAAP Adjusted EBITDA | |||||
For the Years Ended December 31, 2024 and 2023 | |||||
(Unaudited) | |||||
Year Ended December 31, | |||||
($ in thousands) | 2024 | 2023 | |||
Revenue | $313,042 | $296,627 | |||
Operating expenses | |||||
Costs of services (exclusive of depreciation and amortization) | $71,636 | $69,703 | |||
Selling, general, and administrative | $145,466 | $148,653 | |||
Depreciation and amortization | $103,710 | $103,857 | |||
Loss on business disposition | — | $10,027 | |||
Impairment loss | — | $75,800 | |||
Total operating expenses | $320,812 | $408,040 | |||
Loss from operations | ($7,770) | ($111,413) | |||
Interest income | $5,992 | $2,822 | |||
Interest expense | ($7,873) | ($3,870) | |||
Gain on extinguishment of debt | $13,136 | — | |||
Change in fair value of tax receivable liability | ($14,543) | ($6,619) | |||
Other income (loss) | $138 | ($455) | |||
Total other income (expense) | ($3,150) | ($8,122) | |||
Income (Loss) Before Income Tax Benefit (Expense) | ($10,920) | ($119,535) | |||
Income tax benefit (expense) | $575 | $2,115 | |||
Net income (loss) | ($10,345) | ($117,420) | |||
Add | |||||
Interest income | ($5,992) | ($2,822) | |||
Interest expense | $7,873 | $3,870 | |||
Depreciation and amortization(a) | $103,710 | $103,857 | |||
Income tax (benefit) expense | ($575) | ($2,115) | |||
EBITDA | $94,671 | ($14,630) | |||
Loss on business disposition(h) | — | $10,027 | |||
Gain on extinguishment of debt(i) | ($13,136) | — | |||
Non-cash change in fair value of contingent consideration(j) | — | — | |||
Non-cash impairment loss(b) | — | $75,800 | |||
Non-cash change in fair value of assets and liabilities(c) | $14,543 | $7,494 | |||
Share-based compensation expense(d) | $25,195 | $22,156 | |||
Transaction expenses(e) | $2,325 | $8,523 | |||
Restructuring and other strategic initiative costs(f) | $12,494 | $11,908 | |||
Other non-recurring charges(g) | $4,718 | $5,528 | |||
Adjusted EBITDA | $140,810 | $126,806 |
Reconciliation of GAAP Net Income (Loss) to Non-GAAP Adjusted Net Income | |||||
For the Three Months Ended December 31, 2024 and 2023 | |||||
(Unaudited) | |||||
Three Months Ended December 31, | |||||
($ in thousands) | 2024 | 2023 | |||
Revenue | $78,271 | $75,987 | |||
Operating Expenses | |||||
Costs of services (exclusive of depreciation and amortization) | $18,556 | $17,261 | |||
Selling, general, and administrative | $36,503 | $36,679 | |||
Depreciation and amortization | $24,382 | $24,711 | |||
Change in fair value of contingent consideration | — | — | |||
Impairment loss | — | $75,750 | |||
Total operating expenses | $79,441 | $154,401 | |||
Loss from operations | ($1,170) | ($78,414) | |||
Other Income (Expense) | |||||
Interest income | $1,629 | $1,260 | |||
Interest expense | ($3,134) | ($895) | |||
Change in fair value of tax receivable liability | ($1,785) | ($2,903) | |||
Other income (loss) | $76 | ($145) | |||
Total other income (expense) | ($3,214) | ($2,683) | |||
Income (Loss) Before Income Tax Benefit (Expense) | ($4,384) | ($81,097) | |||
Income tax benefit (expense) | $426 | $3,423 | |||
Net income (loss) | ($3,958) | ($77,674) | |||
Add | |||||
Amortization of acquisition-related intangibles(k) | $18,595 | $20,969 | |||
Non-cash impairment loss(b) | — | $75,750 | |||
Non-cash change in fair value of assets and liabilities(c) | $1,785 | $3,778 | |||
Share-based compensation expense(d) | $5,921 | $5,899 | |||
Transaction expenses(e) | $297 | $921 | |||
Restructuring and other strategic initiative costs(f) | $5,524 | $3,372 | |||
Other non-recurring charges(g) | $1,440 | $520 | |||
Non-cash interest expense(l) | $845 | $712 | |||
Pro forma taxes at effective rate(m) | ($8,016) | ($7,906) | |||
Adjusted Net Income | $22,433 | $26,341 | |||
Shares of Class A common stock outstanding (on an as-converted basis)(n) | 93,946,583 | 97,063,687 | |||
Adjusted Net Income per share | $0.24 | $0.27 |
Reconciliation of GAAP Net Income (Loss) to Non-GAAP Adjusted Net Income | ||
---|---|---|
For the Years Ended December 31, 2024 and 2023 | ||
(Unaudited) | ||
Year Ended December 31, | ||
($ in thousands) | 2024 | 2023 |
Revenue | 313,042 | 296,627 |
Operating expenses | ||
Costs of services (exclusive of depreciation and amortization shown separately below) | 71,636 | 69,703 |
Selling, general and administrative | 145,466 | 148,653 |
Depreciation and amortization | 103,710 | 103,857 |
Loss on business disposition | - | 10,027 |
Impairment loss | - | 75,800 |
Total operating expenses | 320,812 | 408,040 |
Loss from operations | (7,770) | (111,413) |
Interest income | 5,992 | 2,822 |
Interest expense | (7,873) | (3,870) |
Gain on extinguishment of debt | 13,136 | - |
Change in fair value of tax receivable liability | (14,543) | (6,619) |
Other income (loss) | 138 | (455) |
Total other income (expense) | (3,150) | (8,122) |
Income (loss) before income tax benefit (expense) | (10,920) | (119,535) |
Income tax benefit (expense) | 575 | 2,115 |
Net income (loss) | (10,345) | (117,420) |
Add | ||
Amortization of acquisition-related intangibles(k) | 77,144 | 81,642 |
Loss on business disposition(h) | - | 10,027 |
Gain on extinguishment of debt(i) | (13,136) | - |
Non-cash change in fair value of contingent consideration(j) | - | - |
Non-cash impairment loss(b) | - | 75,800 |
Non-cash change in fair value of assets and liabilities(c) | 14,543 | 7,494 |
Share-based compensation expense(d) | 25,195 | 22,156 |
Transaction expenses(e) | 2,325 | 8,523 |
Restructuring and other strategic initiative costs(f) | 12,494 | 11,908 |
Other non-recurring charges(g) | 4,718 | 5,528 |
Non-cash interest expense(l) | 3,031 | 2,848 |
Pro forma taxes at effective rate(m) | (28,151) | (23,564) |
Adjusted Net Income | 87,818 | 84,942 |
Shares of Class A common stock outstanding (on an as-converted basis)(n) | 95,678,128 | 96,850,559 |
Adjusted Net Income per share | 0.92 | 0.88 |
Reconciliation of Operating Cash Flow to Free Cash Flow | ||||||||||
For the Three Months and Years Ended December 31, 2024 and 2023 | ||||||||||
(Unaudited) | ||||||||||
Three Months Ended December 31, | Year Ended December 31, | |||||||||
2024 | 2023 | 2024 | 2023 | |||||||
Net cash provided by operating activities | $34,252 | $34,863 | $150,090 | $103,614 | ||||||
Capital expenditures | ||||||||||
Cash paid for property and equipment | ($207) | ($183) | ($989) | ($733) | ||||||
Capitalized software development costs | ($10,586) | ($12,893) | ($43,864) | ($50,083) | ||||||
Total capital expenditures | ($10,793) | ($13,076) | ($44,853) | ($50,816) | ||||||
Free cash flow | $23,459 | $21,787 | $105,237 | $52,798 | ||||||
Free cash flow conversion | 64% | 65% | 75% | 42% |
Quarterly Reconciliation of Operating Cash Flow to Free Cash Flow | |||
(Unaudited) | |||
Three Months ended | |||
March 31, 2024 | June 30, 2024 | September 30, 2024 | |
(in $ thousands) | |||
Net cash provided by operating activities | $24,801 | $30,979 | $60,058 |
Capital expenditures | |||
Cash paid for property and equipment | ($87) | ($484) | ($211) |
Capitalized software development costs | ($11,042) | ($11,207) | ($11,029) |
Total capital expenditures | ($11,129) | ($11,691) | ($11,240) |
Free cash flow | $13,672 | $19,288 | $48,818 |
Free cash flow conversion | 38% | 57% | 139% |
(a) | See footnote (k) for details on amortization and depreciation expenses. |
(b) | For the three months and year ended December 31, 2023, reflects non-cash goodwill impairment loss related to the Business Payments segment. In addition, for the year ended December 31, 2023, reflects non-cash impairment loss related to a trade name write-off of Media Payments. |
(c) | For the three months and year ended December 31, 2024, reflects the changes in management’s estimates of the fair value of the liability relating to the Tax Receivable Agreement. For the three months and year ended December 31, 2023, reflects the changes in management’s estimates of (i) the fair value of the liability relating to the Tax Receivable Agreement, and (ii) non-cash insurance reserve. |
(d) | Represents compensation expense associated with equity compensation plans. |
(e) | Primarily consists of (i) during the three months and year ended December 31, 2024, the three months ended September 30, 2024, the three months ended June 30, 2024 and the three months ended March 31, 2024, professional service fees incurred in connection with prior transactions, and (ii) during the three months and year ended December 31, 2023, professional service fees and other costs incurred in connection with the disposition of Blue Cow Software. |
(f) | Reflects costs associated with reorganization of operations, consulting fees related to processing services and other operational improvements, including restructuring and integration activities related to acquired businesses, that were not in the ordinary course. |
(g) | For the three months and year ended December 31, 2024, reflects one-time processing settlements, franchise taxes and other non-income based taxes, non-recurring legal and other litigation expenses and payments made to third-parties in connection with our IT security and personnel. For the three months ended September 30, 2024, the three months ended June 30, 2024 and the three months ended March 31, 2024, reflects franchise taxes and other non-income based taxes, non-recurring legal and other litigation expenses and payments made to third-parties in connection with our IT security and personnel. For the three months and year ended December 31, 2023, reflects payments made to third-parties in connection with an expansion of our personnel, franchise taxes and other non-income based taxes and one-time payments to certain partners. |
(h) | Reflects the loss recognized related to the disposition of Blue Cow. |
(i) | Reflects a gain on the repurchase of 2026 Notes principal, net of a write-off of debt issuance costs relating to the repurchased principal. |
(j) | Reflects the changes in management’s estimates of future cash consideration to be paid in connection with prior acquisitions from the amount estimated as of the most recent balance sheet date. |
(k) | Reflects amortization of client relationships, non-compete agreement, software, and channel relationship intangibles acquired through the business combination with Thunder Bridge, and client relationships, non-compete agreement, and software intangibles acquired through REPAY's acquisitions of TriSource Solutions, APS Payments, Ventanex, cPayPlus, CPS Payments, BillingTree, Kontrol Payables and Payix. This adjustment excludes the amortization of other intangible assets which were acquired in the regular course of business, such as capitalized internally developed software and purchased software. See additional information below for an analysis of amortization expenses: |
Three months ended December 31, | Year ended December 31, | |||
($ in thousands) | 2024 | 2023 | 2024 | 2023 |
Acquisition-related intangibles | $18,595 | $20,969 | $77,144 | $81,642 |
Software | $5,249 | $3,150 | $24,826 | $19,789 |
Amortization | $23,844 | $24,119 | $101,970 | $101,431 |
Depreciation | $538 | $592 | $1,740 | $2,426 |
Total Depreciation and Amortization (1) | $24,382 | $24,711 | $103,710 | $103,857 |
Three Months Ended | |||
(in $ thousands) | March 31, 2024 | June 30, 2024 | September 30, 2024 |
Acquisition-related intangibles | $19,736 | $19,702 | $19,111 |
Software | $6,713 | $6,856 | $6,008 |
Amortization | $26,449 | $26,558 | $25,119 |
Depreciation | $579 | $213 | $410 |
Total Depreciation and Amortization (1) | $27,028 | $26,771 | $25,529 |
(1) | Adjusted Net Income is adjusted to exclude amortization of all acquisition-related intangibles as such amounts are inconsistent in amount and frequency and are significantly impacted by the timing and/or size of acquisitions (see corresponding adjustments in the reconciliation of net income to Adjusted Net Income presented above). Management believes that the adjustment of acquisition-related intangible amortization supplements GAAP financial measures because it allows for greater comparability of operating performance. Although REPAY excludes amortization from acquisition-related intangibles from its non-GAAP expenses, management believes that it is important for investors to understand that such intangibles were recorded as part of purchase accounting and contribute to revenue generation. Amortization of intangibles that relate to past acquisitions will recur in future periods until such intangibles have been fully amortized. Any future acquisitions may result in the amortization of additional intangibles. |
(l) | Represents amortization of non-cash deferred debt issuance costs. |
(m) | Represents pro forma income tax adjustment effect associated with items adjusted above. |
(n) | Represents the weighted average number of shares of Class A common stock outstanding (on an as-converted basis assuming conversion of outstanding Post-Merger REPAY Units) for the three months and years ended December 31, 2024 and 2023. These numbers do not include any shares issuable upon conversion of the Company’s convertible senior notes. See the reconciliation of basic weighted average shares outstanding to the non-GAAP Class A common stock outstanding on an as-converted basis for each respective period below: |
Three Months Ended December 31, | Year Ended December 31, | |||
2024 | 2023 | 2024 | 2023 | |
Weighted average shares of Class A common stock outstanding - basic | 88,392,571 | 91,206,870 | 89,915,137 | 90,048,638 |
Add: Non-controlling interests | ||||
Weighted average Post-Merger REPAY Units exchangeable for Class A common stock | 5,554,012 | 5,856,817 | 5,762,991 | 6,801,921 |
Shares of Class A common stock outstanding (on an as-converted basis) | 93,946,583 | 97,063,687 | 95,678,128 | 96,850,559 |
View source version on businesswire.com: https://www.businesswire.com/news/home/20250303354271/en/
Investor Relations Contact for REPAY:
ir@repay.com
Media Relations Contact for REPAY:
Kristen Hoyman
(404) 637-1665
khoyman@repay.com
Source: Repay Holdings Corporation
ATLANTA--(BUSINESS WIRE)--Feb. 18, 2025-- Repay Holdings Corporation (NASDAQ: RPAY) (“REPAY” or the “Company”), a leading provider of integrated payment processing solutions, today announced that the Company will host a conference call to discuss fourth quarter and full year 2024 financial results on Monday, March 3, 2025 at 5:00pm ET. A press release with fourth quarter and full year 2024 financial results will be issued after the market closes that same day.
The conference call will be webcast live from the Company's investor relations website at https://investors.repay.com/ under the “Events” section. The conference call can also be accessed live over the phone by dialing (877) 407-3982, or for international callers (201) 493-6780. A replay will be available two hours after the call and can be accessed by dialing (844) 512-2921 or (412) 317-6671 for international callers; the conference ID is 13750988. The replay will be available until Monday, March 17, 2025. An archive of the webcast will be available at the same location on the website shortly after the call has concluded.
About REPAY
REPAY provides integrated payment processing solutions to verticals that have specific transaction processing needs. REPAY’s proprietary, integrated payment technology platform reduces the complexity of electronic payments for clients, while enhancing the overall experience for consumers and businesses.
View source version on businesswire.com: https://www.businesswire.com/news/home/20250218123655/en/
Investor Relations for REPAY:
ir@repay.com
Media Relations for REPAY:
Kristen Hoyman
khoyman@repay.com
Source: Repay Holdings Corporation
New Partnership Facilitates Dealership Finance Optimization, Going Beyond Traditional Automotive to Offer Advanced Payment Automation to Powersports, RV, Marine and Other Retailers
ATLANTA--(BUSINESS WIRE)--Feb. 5, 2025-- Repay Holdings Corporation (NASDAQ: RPAY) (“REPAY”), a leading provider of vertically-integrated payment solutions, today announced a new integration with Lightspeed DMS, the leading recreational dealer management software (DMS) provider. This collaboration marks REPAY’s first major expansion beyond the traditional automotive industry, offering revenue- and productivity-driving payment automation to a wider range of retailers and dealerships.
This new integration with Lightspeed DMS extends REPAY’s vendor payment automation functionality and brings a range of benefits to businesses leveraging the Lightspeed DMS platform. Through REPAY’s advanced automation capabilities, dealerships can ensure on-time payments while maintaining strong positive relationships with their vendors. In addition, by replacing traditional paper checks with digital payments such as virtual cards and ACH, this solution modernizes accounts payable (AP) processes and significantly increases payment security over traditional check printing practices.
"Our partnership with REPAY brings a new level of efficiency to our dealer management system,” said Troy Thibodeau, Chief Marketing and Products Officer at Lightspeed. “By integrating REPAY’s advanced AP technology, we can offer streamlined vendor payments and financial benefits to the businesses that depend on Lightspeed. This collaboration allows us to provide a more seamless and modern payment experience, which is crucial to our customers’ ability to maintain strong relationships with the vehicle manufacturers and partners they depend on.”
For dealership AP professionals, REPAY’s automation technology is a means of driving productivity and ensuring timely execution of vendor payments, eliminating many of the manual processes involved in handling payments that create errors or delays. This automation saves valuable time and resources, allowing teams to focus on more strategic tasks and improving overall efficiency within the organization. By streamlining these processes, dealerships of any size can achieve greater operational efficiency and enhance their financial management goals.
"This integration simplifies payment processes by consolidating all dealership vendor payments into a single platform and workflow, enhancing accuracy and delivering a level of payment security dealerships expect,” said Darin Horrocks, Executive Vice President, Business Payments at REPAY. “We are committed to helping businesses transform their payment processes, and this collaboration sets a new standard for efficiency and payment security in dealership management and payment operations."
About REPAY
REPAY provides integrated payment processing solutions to verticals that have specific transaction processing needs. REPAY’s proprietary, integrated payment technology platform reduces the complexity of electronic payments for clients, while enhancing the overall experience for consumers and businesses.
About Lightspeed DMS LLC
Lightspeed is an all-in-one solution designed to revolutionize dealership management. With Lightspeed, dealerships in the Powersport, Marine, RV, Trailer, Outdoor Power Equipment, and Golf Car industries seamlessly integrate their operations through our comprehensive Dealer Management Solution (DMS). Lightspeed has been empowering over 4,000+ dealers across North America with cutting-edge technology and unparalleled support. From sales to parts, service to rental, and accounting to CRM, Lightspeed offers a unified platform that streamlines every aspect of their client’s business. Lightspeed provides a cohesive ecosystem where every tool and feature originate from the same source, ensuring compatibility and efficiency.
View source version on businesswire.com: https://www.businesswire.com/news/home/20250205638392/en/
Investor Relations Contact for REPAY:
IR@repay.com
Media Relations Contact for REPAY:
Kristen Hoyman
khoyman@repay.com
Source: Repay Holdings Corporation
ATLANTA--(BUSINESS WIRE)- January 29, 2025 -REPAY (NASDAQ: RPAY), a leading provider of vertically-integrated payment solutions, today announced a strategic integration with Worth, the all-in-one fintech platform for underwriting and onboarding workflow automation.
“Worth’s mission to democratize data and provide decision transparency for enterprises is well-aligned with REPAY’s use case. Through our enhanced, data-driven approach, we can accelerate REPAY’s time to revenue for new implementations.” Post this
REPAY’s integration with the Worth platform will enable faster merchant onboarding and high-volume AP vendor enrollments, leveraging Worth’s 1,100-plus data points for precise, transparent and timely decisioning of underwriting and onboarding activities. The tool will be deployed across the Consumer and Business Payments verticals in support of merchant and vendor onboarding activities respectively.
“Partnering with REPAY allows us to deliver industry-leading data and tools in support of their merchant and vendor onboarding processes,” said Sal Rehmetullah,
Worth co-founder and CEO. “Worth’s mission to democratize data and provide decision transparency for enterprises is well-aligned with REPAY’s use case. Through our enhanced, data-driven approach, we can accelerate REPAY’s time to revenue for new implementations.”
“Our integration with Worth should reduce time spent on merchant onboarding while helping to mitigate KYB risk with the intelligent data provided through the platform,” said David Guthrie, CTO of REPAY. “By embedding the Worth advanced financial tools into our merchant underwriting and vendor onboarding processes, we can quickly and safely add businesses to the REPAY ecosystem.”
About REPAY
REPAY provides integrated payment processing solutions to verticals that have specific transaction processing needs. REPAY's proprietary, integrated payment technology platform reduces the complexity of electronic payments for clients while enhancing the overall experience for consumers and businesses. For more information, please visit repay.com.
About Worth
Worth is a leading fintech platform that automates onboarding and underwriting for financial institutions. Powered by a large database with millions of small businesses, the all-in-one solution integrates workflow automation, Know Your Business (KYB), Know Your Customer (KYC), bank verification, fraud detection, and credit underwriting. This enables enterprises to onboard customers quickly and confidently. With deep insights into small business data, Worth accelerates time-to-revenue while fostering a more equitable financial ecosystem where both enterprises and small businesses can thrive. For more information, please visit https://worthai.com/.
Contacts
Investor Relations Contact for REPAY:
IR@repay.com
Media Relations Contact for REPAY:
Kristen Hoyman
khoyman@repay.com
Payment Awards - January 28, 2025 - Recognized companies include Worldpay, CSG Forte, REPAY, JPMorgan Chase, and Elavon.
TSG (The Strawhecker Group), a globally recognized analytics, intelligence, and solutions-focused firm in the payments industry, is pleased to recognize a selection of payments companies for their exceptional performance across areas critical to a successful platform.
Leveraging its Global Experience Monitoring (GEM) platform, GEM benchmarks payment gateway performance by monitoring real credit card transactions and pings (not synthetic) from over 35 global locations across North America, South America, Europe, and Asia Pacific. GEM complements internal tools by offering a merchant-focused perspective, helping gateways assess market position, identify improvement areas, and address issues in real-time.
“We’re thrilled to recognize the payment gateways that demonstrated exceptional performance in 2024,” said Mike Strawhecker, President of TSG. “In a highly competitive industry, these gateways lead the way in prioritizing reliability, scalability, and performance, which is reflected in the results.”
GEM supports gateways in safeguarding their brand, improving end-user experiences, swiftly addressing issues, and preventing revenue losses. The platform delivers a comprehensive touchpoint monitoring solution designed specifically for payments.
Data was assessed across more than 20 industry-leading global payments providers in 2024 to determine the awards. TSG will announce the year’s leading payment gateway APIs in June.
Best Performing Gateway
The Best Performing Gateway award is based on the GEM Index, an overall scorecard for gateway metrics based on six key areas (gateway minute outage, gateway access, gateway availability, transaction speed, transaction success rate, and authorization rate).
Winner: Worldpay (Express)
Runners-Up: JPMorgan Chase (United Payment Gateway) / Elavon (Fusebox)
Best Gateway Uptime
GEM measures performance checks from over 35 global locations to determine uptime, focusing on the gateway’s availability.
Winner: CSG Forte
Runner-Up: REPAY
Fastest Transactions

GEM measures the time it takes for a transaction authorization to complete using a signature debit and a credit card, just as a consumer would experience at the merchant.
Winner: Worldpay (Express)
Runners-Up: JPMorgan Chase (United Payment Gateway) / Elavon (Fusebox)
Highest Authorization Rate

GEM tracks the percentage of authorization failures a gateway experiences daily unrelated to the issuer, network, or cardholder.
Winner: REPAY
Runners-Up: Elavon (Converge) / Worldpay (Express)
Lowest Gateway Minute Outage
(North America)

GEM pings locations in the United States and Canada to determine minute outages. An outage is recorded if at least 25% of location checks fail simultaneously.
Winner: CSG Forte
Runner-Up: Worldpay (Express)
Lowest Gateway Minute Outage
(Global)

GEM pings locations in North America, South America, Europe, and the Asia Pacific to determine minute outages. An outage is recorded if at least 50% of location checks fail simultaneously.
Winner: Worldpay (Access)
Runner-Up: Worldpay (Worldwide Payment Gateway)
TSG can evaluate, benchmark, and help improve your gateway’s performance. Payments companies that use GEM to monitor and improve this process can increase customer retention by 5% or more. For more information about TSG and the GEM platform, please contact us online or call 1-833-690-1301. For media inquiries, please email mediarelations@tsgpayments.com.
Companies and/or products considered for any TSG awards may or may not include clients of TSG and does not necessarily represent all companies or products in the market. This analysis is based upon information we consider reliable, but its accuracy and completeness cannot be guaranteed. Information provided is not all inclusive. All information listed is as available based on 2024 reporting. TSG is not and/or may not be endorsed, sponsored by, or in any other way affiliated with the companies or their logos illustrated. The trademarks shown are registered and their own. This document has not been prepared by any entity displayed.
Gross Profit Growth of 9% in Q3 and 8% YTD (9% YTD on an organic basis1)
Strong Adjusted EBITDA Growth and Accelerating Free Cash Flow Conversion
Updated 2024 Outlook, Increasing Free Cash Flow Conversion for 2024
ATLANTA--(BUSINESS WIRE)--Nov. 12, 2024-- Repay Holdings Corporation (NASDAQ: RPAY) (“REPAY” or the “Company”), a leading provider of vertically-integrated payment solutions, today reported financial results for its third quarter ended September 30, 2024.
Third Quarter 2024 Financial Highlights
($ in millions) | Q3 2023 | Q4 2023 | Q1 2024 | Q2 2024 | Q3 2024 | YoY Change | |||||
Revenue | 74.3 | 76.0 | 80.7 | 74.9 | 79.1 | 6% | |||||
Gross profit (1) | 56.7 | 58.7 | 61.5 | 58.6 | 61.6 | 9% | |||||
Net (loss) income | (6.5) | (77.7) | (5.4) | (4.2) | 3.2 | - | |||||
Adjusted EBITDA (2) | 31.9 | 33.5 | 35.5 | 33.7 | 35.1 | 10% | |||||
Net cash provided by operating activities | 28.0 | 34.9 | 24.8 | 31.0 | 60.1 | 115% | |||||
Free Cash Flow (2) | 13.9 | 21.8 | 13.7 | 19.3 | 48.8 | 250% |
(1) | Gross profit represents revenue less costs of services (exclusive of depreciation and amortization). | |
(2) | Adjusted EBITDA and Free Cash Flow are non-GAAP financial measures. See “Non-GAAP Financial Measures” and the reconciliation of Adjusted EBITDA and Free Cash Flow to their most comparable GAAP measure provided below for additional information. |
“Q3 represented another quarter of profitable growth and accelerating Free Cash Flow conversion at REPAY,” said John Morris, CEO of REPAY. “We continue to see growth across many areas of our business and remain focused on executing our strategy to capture embedded payment flows from clients within our verticals. We believe this approach, along with new software partnerships and further enhancing our payment technology platform, will continue to help us drive sustainable growth, strong cash generation, and value for our shareholders. REPAY remains committed to efficiently allocating capital, which may include organic investments, strategic M&A, and opportunistically repurchasing shares.”
Third Quarter 2024 Business Highlights
The Company's achievements in the quarter, including those highlighted below, reinforce management's belief in the ability of the Company to drive durable and sustained growth across REPAY's diversified business model.
- 9% year-over-year gross profit growth in Q3
- Consumer Payments gross profit growth of approximately 2% year-over-year and 6% year-to-date
- Business Payments gross profit growth of approximately 67% year-over-year and 33% year-to-date
- Accelerated AP supplier network to over 330,000, an increase of approximately 42% year-over-year
- Added three new integrated software partners to bring the total to 276 software relationships as of the end of the third quarter
- Instant funding volumes increased by approximately 24% year-over-year
- Added 13 new credit unions bringing total credit union clients to 313
1 Organic gross profit growth is a non-GAAP financial measure. See “Non-GAAP Financial Measures” and the reconciliation to its most comparable GAAP measure provided below for additional information. |
Segments
The Company reports its financial results based on two reportable segments.
Consumer Payments –The Consumer Payments segment provides payment processing solutions (including debit and credit card processing, Automated Clearing House (“ACH”) processing and other electronic payment acceptance solutions, as well as REPAY’s loan disbursement product) that enable REPAY’S clients to collect payments from and disburse funds to consumers and includes its clearing and settlement solutions (“RCS”). RCS is REPAY’s proprietary clearing and settlement platform through which it markets customizable payment processing programs to other ISOs and payment facilitators. The strategic vertical markets served by the Consumer Payments segment primarily include personal loans, automotive loans, receivables management, credit unions, mortgage servicing, consumer healthcare and diversified retail.
Business Payments –The Business Payments segment provides payment processing solutions (including accounts payable automation, debit and credit card processing, virtual credit card processing, ACH processing and other electronic payment acceptance solutions) that enable REPAY’s clients to collect payments from or send payments to other businesses. The strategic vertical markets served within the Business Payments segment primarily include retail automotive, education, field services, governments and municipalities, healthcare, media, homeowner association management and hospitality.
Segment Revenue, Gross Profit, and Gross Profit Margin
Three Months ended September 30, | Nine Months ended September 30, | |||||
($ in thousand) | 2024 | 2023 | % Change | 2024 | 2023 | % Change |
Revenue | ||||||
Consumer Payments | $69,189 | $68,720 | 1% | $214,617 | $204,622 | 5% |
Business Payments | 15,297 | 9,704 | 58% | 35,566 | 28,170 | 26% |
Elimination of intersegment revenues | (5,341) | (4,104) | (15,412) | (12,152) | ||
Total revenue | $79,145 | $74,320 | 6% | $234,771 | $220,640 | 6% |
Gross profit (1) | ||||||
Consumer Payments | $54,889 | $53,599 | 2% | $170,026 | $159,929 | 6% |
Business Payments | 12,013 | 7,188 | 67% | 27,077 | 20,421 | 33% |
Elimination of intersegment revenues | (5,341) | (4,104) | (15,412) | (12,152) | ||
Total gross profit | $61,561 | $56,683 | 9% | $181,691 | $168,198 | 8% |
Total gross profit margin (2) | 78% | 76% | 77% | 76% |
(1) | Gross profit represents revenue less costs of services (exclusive of depreciation and amortization). | |
(2) | Gross profit margin represents total gross profit / total revenue. |
2024 Outlook Update
“REPAY’s solid year-to-date results gives us the confidence in double-digit Adjusted EBITDA growth and accelerating Free Cash Flow Conversion,” said Tim Murphy, CFO of REPAY. “We are updating our reported Free Cash Flow Conversion target from approximately 60% to approximately 65% as we benefited from a one-time net working capital impact during the year. Our focus in 2024 remains on profitable growth and reducing overall capex spending to achieve our targeted Free Cash Flow Conversion.”
REPAY updated its outlook for full year 2024, as shown below.
Full Year 2024 Outlook | |
Revenue | $314 - 320 billion |
Gross Profit | $245 - 250 million |
Adjusted EBITDA | $139 - 142 million |
Free Cash Flow Conversion(1) | ~ 65% |
(1)Free Cash Flow Conversion represents Free Cash Flow / Adjusted EBITDA. Free Cash Flow and Adjusted EBITDA are non-GAAP financial measures. See “Non-GAAP Financial Measures” and the reconciliation of Free Cash Flow and Adjusted EBITDA to their most comparable GAAP measure provided below for additional information. |
REPAY does not provide quantitative reconciliation of forward-looking, non-GAAP financial measures, such as forecasted 2024 Adjusted EBITDA and Free Cash Flow Conversion, to the most directly comparable GAAP financial measure, because it is difficult to reliably predict or estimate the relevant components without unreasonable effort due to future uncertainties that may potentially have a significant impact on such calculations, and providing them may imply a degree of precision that would be confusing or potentially misleading.
Conference Call
REPAY will host a conference call to discuss third quarter 2024 financial results today, November 12, 2024 at 5:00 pm ET. Hosting the call will be John Morris, CEO, and Tim Murphy, CFO. The call will be webcast live from REPAY’s investor relations website at https://investors.repay.com/investor-relations. The conference call can also be accessed live over the phone by dialing (877) 407-3982, or for international callers (201) 493-6780. A replay will be available one hour after the call and can be accessed by dialing (844) 512-2921 or (412) 317-6671 for international callers; the conference ID is 13748834. The replay will be available at https://investors.repay.com/investor-relations.
Non-GAAP Financial Measures
This report includes certain non-GAAP financial measures that management uses to evaluate the Company’s operating business, measure performance, and make strategic decisions. Adjusted EBITDA is a non-GAAP financial measure that represents net income prior to interest expense, tax expense, depreciation and amortization, as adjusted to add back certain charges deemed to not be part of normal operating expenses, non-cash charges and/or non-recurring charges, such as gain on debt extinguishment, loss on business disposition, non-cash impairment loss, non-cash change in fair value of assets and liabilities, share-based compensation charges, transaction expenses, restructuring and other strategic initiative costs and other non-recurring charges. Adjusted Net Income is a non-GAAP financial measure that represents net income prior to amortization of acquisition-related intangibles, as adjusted to add back certain charges deemed to not be part of normal operating expenses, gain on debt extinguishment, loss on business disposition, non-cash impairment loss, non-cash charges and/or non-recurring charges, such as loss on business disposition, non-cash change in fair value of assets and liabilities, share-based compensation expense, transaction expenses, restructuring and other strategic initiative costs, other non-recurring charges, non-cash interest expense and net of tax effect associated with these adjustments. Adjusted Net Income is adjusted to exclude amortization of all acquisition-related intangibles as such amounts are inconsistent in amount and frequency and are significantly impacted by the timing and/or size of acquisitions. Management believes that the adjustment of acquisition-related intangible amortization supplements GAAP financial measures because it allows for greater comparability of operating performance. Although REPAY excludes amortization from acquisition-related intangibles from its non-GAAP expenses, management believes that it is important for investors to understand that such intangibles were recorded as part of purchase accounting and contribute to revenue generation. Adjusted Net Income per share is a non-GAAP financial measure that represents Adjusted Net Income divided by the weighted average number of shares of Class A common stock outstanding (on an as-converted basis assuming conversion of the outstanding units exchangeable for shares of Class A common stock) for the three and nine months ended September 30, 2024 and 2023 (excluding shares subject to forfeiture). Organic gross profit growth is a non-GAAP financial measure that represents year-on-year gross profit growth that excludes incremental gross profit attributable to acquisitions and divestitures made in the applicable prior period or any subsequent period. Free Cash Flow is a non-GAAP financial measure that represents net cash flow provided by operating activities less total capital expenditures. Free Cash Flow Conversion represents Free Cash Flow divided by Adjusted EBITDA. REPAY believes that Adjusted EBITDA, Adjusted Net Income, Adjusted Net Income per share, organic gross profit growth, Free Cash Flow and Free Cash Flow Conversion provide useful information to investors and others in understanding and evaluating its operating results in the same manner as management. However, these non-GAAP financial measures are not financial measures calculated in accordance with GAAP and should not be considered as a substitute for net income, operating profit, net cash provided by operating activities, or any other operating performance measure calculated in accordance with GAAP. Using these non-GAAP financial measures to analyze REPAY’s business has material limitations because the calculations are based on the subjective determination of management regarding the nature and classification of events and circumstances that investors may find significant. In addition, although other companies in REPAY’s industry may report measures titled as the same or similar measures, such non-GAAP financial measures may be calculated differently from how REPAY calculates its non-GAAP financial measures, which reduces their overall usefulness as comparative measures. Because of these limitations, you should consider REPAY’s non-GAAP financial measures alongside other financial performance measures, including net income, net cash provided by operating activities and REPAY’s other financial results presented in accordance with GAAP.
Forward-Looking Statements
This communication contains “forward-looking statements” within the meaning of the Private Securities Litigation Reform Act of 1995. Such statements include, but are not limited to, statements about future financial and operating results, REPAY’s plans, objectives, expectations and intentions with respect to future operations, products and services; and other statements identified by words such as “guidance,” “will likely result,” “are expected to,” “will continue,” “should,” “is anticipated,” “estimated,” “believe,” “intend,” “plan,” “projection,” “outlook” or words of similar meaning. These forward-looking statements include, but are not limited to, REPAY’s 2024 outlook update and other financial guidance, statements regarding REPAY’s market and growth opportunities, REPAY’s business strategy and the plans and objectives of management for future operations and the allocation of capital. Such forward-looking statements are based upon the current beliefs and expectations of REPAY’s management and are inherently subject to significant business, economic and competitive uncertainties and contingencies, many of which are difficult to predict and generally beyond REPAY’s control.
In addition to factors disclosed in REPAY’s reports filed with the U.S. Securities and Exchange Commission, including its Annual Report on Form 10-K for the year ended December 31, 2023 and subsequent Form 10-Qs, and those identified elsewhere in this communication, the following factors, among others, could cause actual results and the timing of events to differ materially from the anticipated results or other expectations expressed in the forward-looking statements: exposure to economic conditions and political risk affecting the consumer loan market, the receivables management industry and consumer and commercial spending, including bank failures or other adverse events affecting financial institutions, inflationary pressures, general economic slowdown or recession; changes in the payment processing market in which REPAY competes, including with respect to its competitive landscape, technology evolution or regulatory changes; changes in the vertical markets that REPAY targets, including the regulatory environment applicable to REPAY’s clients; the ability to retain, develop and hire key personnel; risks relating to REPAY’s relationships within the payment ecosystem; risk that REPAY may not be able to execute its growth strategies, including identifying and executing acquisitions; risks relating to data security; changes in accounting policies applicable to REPAY; and the risk that REPAY may not be able to maintain effective internal controls.
Actual results, performance or achievements may differ materially, and potentially adversely, from any projections and forward-looking statements and the assumptions on which those forward-looking statements are based. There can be no assurance that the data contained herein is reflective of future performance to any degree. You are cautioned not to place undue reliance on forward-looking statements as a predictor of future performance. All information set forth herein speaks only as of the date hereof in the case of information about REPAY or the date of such information in the case of information from persons other than REPAY, and REPAY disclaims any intention or obligation to update any forward-looking statements as a result of developments occurring after the date of this communication. Forecasts and estimates regarding REPAY’s industry and end markets are based on sources it believes to be reliable, however there can be no assurance these forecasts and estimates will prove accurate in whole or in part. Pro forma, projected and estimated numbers are used for illustrative purpose only, are not forecasts and may not reflect actual results.
About REPAY
REPAY provides integrated payment processing solutions to verticals that have specific transaction processing needs. REPAY’s proprietary, integrated payment technology platform reduces the complexity of electronic payments for clients, while enhancing the overall experience for consumers and businesses.
Condensed Consolidated Statement of Operations (Unaudited)
Three Months ended September 30, | Nine Months ended September 30 | ||||
($ in thousands, except per share data) | 2024 | 2023 | 2024 | 2023 | |
Revenue | $79,145 | $74,320 | $234,771 | $220,640 | |
Operating expenses | |||||
Costs of services (exclusive of depreciation and amortization shown separately below) | 17,584 | 17,637 | 53,080 | 52,442 | |
Selling, general and administrative | 36,707 | 35,279 | 108,963 | 111,974 | |
Depreciation and amortization | 25,529 | 26,523 | 79,328 | 79,146 | |
Loss on business disposition | - | - | - | 10,027 | |
Total operating expenses | 79,820 | 79,439 | 241,371 | 253,589 | |
Loss from operations | (675) | (5,119) | (6,600) | (32,949) | |
Other income (expense) | |||||
Interest (expense) income, net | (1,310) | (103) | (376) | (1,413) | |
Gain on extinguishment of debt | 13,136 | - | 13,136 | - | |
Change in fair value of tax receivable liability | (6,479) | (3,234) | (12,758) | (3,716) | |
Other income (loss), net | 67 | (26) | 62 | (360) | |
Total other income (expense) | 5,414 | (3,363) | 64 | (5,489) | |
Income (loss) before income tax expense | 4,739 | (8,482) | (6,536) | (38,438) | |
Income tax benefit (expense) | (1,524) | 1,998 | 149 | (1,308) | |
Net income (loss) | $3,215 | (6,484) | ($6,387) | (39,746) | |
Net loss attributable to non-controlling interest | (28) | (316) | (347) | (2,543) | |
Net income (loss) attributable to the Company | $3,243 | (6,168) | ($6,040) | (37,203) | |
Weighted-average shares of Class A common stock outstanding - basic | 88,263,285 | 91,160,415 | 90,426,364 | 89,658,318 | |
Weighted-average shares of Class A common stock outstanding - diluted | 103,129,907 | 91,160,415 | 90,426,364 | 89,658,318 | |
Income (loss) per Class A share - basic | $0.04 | ($0.07) | ($0.07) | ($0.41) | |
Income (loss) per Class A share - diluted | $0.03 | ($0.07) | ($0.07) | ($0.41) |
Condensed Consolidated Balance Sheets
($ in thousands) | September 30, 2024 (Unaudited) | December 31, 2023 | ||
Assets | ||||
Cash and cash equivalents | $168,715 | $118,096 | ||
Accounts receivable | 41,124 | 36,017 | ||
Prepaid expenses and other | 14,930 | 15,209 | ||
Total current assets | 224,769 | 169,322 | ||
Property, plant and equipment, net | 2,713 | 3,133 | ||
Restricted cash | 46,540 | 26,049 | ||
Intangible assets, net | 402,292 | 447,141 | ||
Goodwill | 716,793 | 716,793 | ||
Operating lease right-of-use assets, net | 11,564 | 8,023 | ||
Deferred tax assets | 157,097 | 146,872 | ||
Other assets | 2,500 | 2,500 | ||
Total noncurrent assets | 1,339,499 | 1,350,511 | ||
Total assets | $1,564,268 | $1,519,833 | ||
Liabilities | ||||
Accounts payable | $28,792 | $22,030 | ||
Accrued expenses | 52,246 | 32,906 | ||
Current operating lease liabilities | 1,199 | 1,629 | ||
Current tax receivable agreement | - | 580 | ||
Other current liabilities | 1,026 | 318 | ||
Total current liabilities | 83,263 | 57,463 | ||
Long-term debt | 496,214 | 434,166 | ||
Noncurrent operating lease liabilities | 10,958 | 7,247 | ||
Tax receivable agreement, net of current portion | 201,273 | 188,331 | ||
Other liabilities | 2,861 | 1,838 | ||
Total noncurrent liabilities | 711,306 | 631,582 | ||
Total liabilities | $794,569 | $689,045 | ||
Commitments and contingencies | ||||
Stockholders' equity | ||||
Class A common stock, $0.0001 par value; 2,000,000,000 shares authorized; 93,213,403 issued and 87,720,670 outstanding as of September 30, 2024 ; 92,220,494 issued and 90,803,984 outstanding as of December 31, 2023 | 9 | 9 | ||
Class V common stock, $0.0001 par value; 1,000 shares authorized and 100 shares issued and outstanding as of September 30, 2024 and December 31, 2023 | — | — | ||
Treasury stock, 5,492,733 and 1,416,510 shares as of September 30, 2024 and December 31, 2023, respectively | (53,782) | (12,528) | ||
Additional paid-in capital | 1,138,160 | 1,151,324 | ||
Accumulated deficit | (329,710) | (323,670) | ||
Total REPAY stockholders' equity | $754,677 | $815,135 | ||
Non-controlling interests | 15,022 | 15,653 | ||
Total equity | 769,699 | 830,788 | ||
Total liabilities and equity | $1,564,268 | $1,519,833 |
Condensed Consolidated Statements of Cash Flows
(Unaudited)
Nine Months ended September 30, | |||
($ in thousands) | 2024 | 2023 | |
Cash flows from operating activities | |||
Net loss | ($6,387) | ($39,746) | |
Adjustments to reconcile net loss to net cash provided by operating activities: | |||
Depreciation and amortization | 79,328 | 79,146 | |
Stock based compensation | 18,495 | 16,256 | |
Amortization of debt issuance costs | 2,185 | 2,136 | |
Loss on business disposition | - | 10,027 | |
Gain on extinguishment of debt | (13,136) | - | |
Other loss | - | 273 | |
Fair value change in tax receivable agreement liability | 12,758 | 3,716 | |
Deferred tax expense | (149) | 1,308 | |
Change in accounts receivable | (5,107) | (4,857) | |
Change in prepaid expenses and other | 279 | 4,161 | |
Change in operating lease ROU assets | (3,541) | 389 | |
Change in accounts payable | 6,762 | (1,948) | |
Change in accrued expenses and other | 19,339 | (1,544) | |
Change in operating lease liabilities | 3,281 | (424) | |
Change in other liabilities | 1,731 | (142) | |
Net cash provided by operating activities | 115,838 | 68,751 | |
Cash flows from investing activities | |||
Purchases of property and equipment | (782) | (1,062) | |
Capitalized software development costs | (33,278) | (36,678) | |
Proceeds from sale of business, net of cash retained | - | 40,273 | |
Net cash provided by (used in) investing activities | (34,060) | 2,533 | |
Cash flows from financing activities | |||
Issuance of long-term debt | 287,500 | - | |
Payments on long-term debt | (205,150) | (20,000) | |
Payments of debt issuance costs | (9,350) | - | |
Payments for tax withholding related to shares vesting under Incentive Plan | (2,720) | (1,510) | |
Treasury shares repurchased | (41,577) | - | |
Stock options exercised | 395 | - | |
Distributions to Members | - | (947) | |
Purchase of capped calls related to issuance of convertible notes | (39,186) | - | |
Payment of Tax Receivable Agreement | (580) | - | |
Payment of contingent consideration liability up to acquisition-date fair value | - | (1,000) | |
Net cash used in financing activities | (10,668) | (23,457) | |
Increase in cash, cash equivalents and restricted cash | 71,110 | 47,827 | |
Cash, cash equivalents and restricted cash at beginning of period | $144,145 | $93,563 | |
Cash, cash equivalents and restricted cash at end of period | $215,255 | $141,390 | |
SUPPLEMENTAL DISCLOSURE OF CASH FLOW INFORMATION | |||
Cash paid during the year for: | |||
Interest | $643 | $840 | |
Income taxes | $2,045 | $1,201 |
Reconciliation of GAAP Net Income (Loss) to Non-GAAP Adjusted EBITDA
For the Three Months Ended September 30, 2024 and 2023
(Unaudited)
Three Months ended September 30, | ||
($ in thousands) | 2024 | 2023 |
Revenue | $79,145 | $74,320 |
Operating expenses | ||
Costs of services (exclusive of depreciation and amortization shown separately below) | $17,584 | $17,637 |
Selling, general and administrative | 36,707 | 35,279 |
Depreciation and amortization | 25,529 | 26,523 |
Total operating expenses | $79,820 | $79,439 |
Loss from operations | ($675) | ($5,119) |
Other income (expense) | ||
Interest (expense) income, net | (1,310) | (103) |
Gain on extinguishment of debt | 13,136 | - |
Change in fair value of tax receivable liability | (6,479) | (3,234) |
Other income (loss), net | 67 | (26) |
Total other income (expense) | 5,414 | (3,363) |
Income (loss) before income tax benefit (expense) | 4,739 | (8,482) |
Income tax benefit (expense) | (1,524) | 1,998 |
Net income (loss) | 3,215 | ($6,484) |
Add: | ||
Interest expense (income), net | 1,310 | 103 |
Depreciation and amortization (a) | 25,529 | 26,523 |
Income tax expense | 1,524 | (1,998) |
EBITDA | $31,578 | $18,144 |
Gain on extinguishment of debt (b) | (13,136) | - |
Non-cash change in fair value of assets and liabilities (c) | 6,479 | 3,234 |
Share-based compensation expense (d) | 6,477 | 5,686 |
Transaction expenses (e) | 937 | 812 |
Restructuring and other strategic initiative costs (f) | 2,202 | 3,084 |
Other non-recurring charges (g) | 562 | 894 |
Adjusted EBITDA | $35,099 | $31,854 |
Quarterly Reconciliation of GAAP Net Income (Loss) to Non-GAAP Adjusted EBITDA
(Unaudited)
Three Months ended | |||
($ in thousands) | December 31, 2023 | March 31, 2024 | June 30, 2024 |
Net income (loss) | ($77,674) | ($5,365) | ($4,237) |
Add: | |||
Interest expense (income), net | (365) | (380) | (554) |
Depreciation and amortization (a) | 24,711 | 27,028 | 26,771 |
Income tax (benefit) expense | (3,423) | 302 | (1,975) |
EBITDA | ($56,751) | $21,585 | $20,005 |
Non-cash impairment loss (i) | 75,750 | - | - |
Non-cash change in fair value of assets and liabilities (c) | 3,778 | 2,913 | 3,366 |
Share-based compensation expense (d) | 5,899 | 6,923 | 5,874 |
Transaction expenses (e) | 921 | 677 | 414 |
Restructuring and other strategic initiative costs (f) | 3,372 | 2,184 | 2,584 |
Other non-recurring charges (g) | 520 | 1,231 | 1,485 |
Adjusted EBITDA | $33,489 | $35,513 | $33,728 |
Reconciliation of GAAP Net Income (Loss) to Non-GAAP Adjusted EBITDA
For the Nine Months Ended September 30, 2024 and 2023
(Unaudited)
Nine Months ended September 30, | ||
($ in thousands) | 2024 | 2023 |
Revenue | $234,771 | $220,640 |
Operating expenses | ||
Costs of services (exclusive of depreciation and amortization shown separately below) | $53,080 | $52,442 |
Selling, general and administrative | 108,963 | 111,974 |
Depreciation and amortization | 79,328 | 79,146 |
Loss on business disposition | - | 10,027 |
Total operating expenses | $241,371 | $253,589 |
Loss from operations | ($6,600) | ($32,949) |
Other income (expense) | ||
Interest (expense) income, net | (376) | (1,413) |
Gain on extinguishment of debt | 13,136 | - |
Change in fair value of tax receivable liability | (12,758) | (3,716) |
Other income (loss), net | 62 | (360) |
Total other income (expense) | 64 | (5,489) |
Income (loss) before income tax expense | (6,536) | (38,438) |
Income tax benefit (expense) | 149 | (1,308) |
Net income (loss) | ($6,387) | ($39,746) |
Add: | ||
Interest expense (income), net | 376 | 1,413 |
Depreciation and amortization (a) | 79,328 | 79,146 |
Income tax (benefit) expense | (149) | 1,308 |
EBITDA | $73,168 | $42,121 |
Loss on business disposition (h) | - | 10,027 |
Non-cash impairment loss (i) | - | 50 |
Gain on extinguishment of debt (b) | (13,136) | - |
Non-cash change in fair value of assets and liabilities (c) | 12,758 | 3,716 |
Share-based compensation expense (d) | 19,274 | 16,257 |
Transaction expenses (e) | 2,028 | 7,602 |
Restructuring and other strategic initiative costs (f) | 6,970 | 8,536 |
Other non-recurring charges (g) | 3,278 | 5,008 |
Adjusted EBITDA | $104,340 | $93,317 |
Reconciliation of GAAP Net Income (Loss) to Non-GAAP Adjusted Net Income
For the Three Months Ended September 30, 2024 and 2023
(Unaudited)
Three Months ended September 30, | ||
($ in thousands) | 2024 | 2023 |
Revenue | $79,145 | $74,320 |
Operating expenses | ||
Costs of services (exclusive of depreciation and amortization shown separately below) | $17,584 | $17,637 |
Selling, general and administrative | 36,707 | 35,279 |
Depreciation and amortization | 25,529 | 26,523 |
Total operating expenses | $79,820 | $79,439 |
Loss from operations | ($675) | ($5,119) |
Interest (expense) income, net | (1,310) | (103) |
Gain on extinguishment of debt | 13,136 | - |
Change in fair value of tax receivable liability | (6,479) | (3,234) |
Other income (loss), net | 67 | (26) |
Total other income (expense) | 5,414 | (3,363) |
Income (loss) before income tax benefit (expense) | 4,739 | (8,482) |
Income tax benefit (expense) | (1,524) | 1,998 |
Net income (loss) | $3,215 | ($6,484) |
Add: | ||
Amortization of acquisition-related intangibles (j) | 19,111 | 19,786 |
Gain on extinguishment of debt (b) | (13,136) | - |
Non-cash change in fair value of assets and liabilities (c) | 6,479 | 3,234 |
Share-based compensation expense (d) | 6,477 | 5,686 |
Transaction expenses (e) | 937 | 812 |
Restructuring and other strategic initiative costs (f) | 2,202 | 3,084 |
Other non-recurring charges (g) | 562 | 894 |
Non-cash interest expense (k) | 762 | 712 |
Pro forma taxes at effective rate (l) | (5,364) | (7,828) |
Adjusted Net Income | $21,245 | $19,896 |
Shares of Class A common stock outstanding (on an as-converted basis) (m) | 94,074,811 | 97,052,574 |
Adjusted Net Income per share | $0.23 | $0.21 |
Reconciliation of GAAP Net Income (Loss) to Non-GAAP Adjusted Net Income
For the Nine Months Ended September 30, 2024 and 2023
(Unaudited)
Nine Months ended September 30, | ||
($ in thousands) | 2024 | 2023 |
Revenue | $234,771 | $220,640 |
Operating expenses | ||
Costs of services (exclusive of depreciation and amortization shown separately below) | $53,080 | $52,442 |
Selling, general and administrative | 108,963 | 111,974 |
Depreciation and amortization | 79,328 | 79,146 |
Loss on business disposition | - | 10,027 |
Total operating expenses | $241,371 | $253,589 |
Loss from operations | ($6,600) | ($32,949) |
Other expenses | ||
Interest (expense) income, net | (376) | (1,413) |
Gain on extinguishment of debt | 13,136 | - |
Change in fair value of tax receivable liability | (12,758) | (3,716) |
Other income (loss), net | 62 | (360) |
Total other income (expense) | 64 | (5,489) |
Income (loss) before income tax expense | (6,536) | (38,438) |
Income tax benefit (expense) | 149 | (1,308) |
Net income (loss) | ($6,387) | ($39,746) |
Add: | ||
Amortization of acquisition-related intangibles (j) | 58,549 | 60,673 |
Loss on business disposition (h) | - | 10,027 |
Non-cash impairment loss (i) | - | 50 |
Gain on extinguishment of debt (b) | (13,136) | - |
Non-cash change in fair value of assets and liabilities (c) | 12,758 | 3,716 |
Share-based compensation expense (d) | 19,274 | 16,257 |
Transaction expenses (e) | 2,028 | 7,602 |
Restructuring and other strategic initiative costs (f) | 6,970 | 8,536 |
Other non-recurring charges (g) | 3,278 | 5,008 |
Non-cash interest expense (k) | 2,186 | 2,136 |
Pro forma taxes at effective rate (l) | (20,135) | (15,658) |
Adjusted Net Income | $65,385 | $58,601 |
Shares of Class A common stock outstanding (on an as-converted basis) (m) | 96,259,523 | 96,778,735 |
Adjusted Net Income per share | $0.68 | $0.61 |
Reconciliation of Operating Cash Flow to Free Cash Flow
For the Three and Nine Months Ended September 30, 2024 and 2023
(Unaudited)
Three Months ended September 30, | Nine Months ended September 30, | |||
($ in thousands) | 2024 | 2023 | 2024 | 2023 |
Net cash provided by operating activities | $60,058 | $27,967 | $115,838 | $68,751 |
Capital expenditures | ||||
Cash paid for property and equipment | (211) | (948) | (782) | (1,062) |
Capitalized software development costs | (11,029) | (13,078) | (33,278) | (36,678) |
Total capital expenditures | (11,240) | (14,026) | (34,060) | (37,740) |
Free cash flow | $48,818 | $13,941 | $81,778 | $31,011 |
Free cash flow conversion | 139% | 44% | 78% | 33% |
Quarterly Reconciliation of Operating Cash Flow to Free Cash Flow
(Unaudited)
Three Months ended | |||
($ in thousands) | December 31,2023 | March 31, 2024 | June 30, 2024 |
Net cash provided by operating activities | $34,863 | $24,801 | $30,979 |
Capital expenditures | |||
Cash paid for property and equipment | (183) | (87) | (484) |
Capitalized software development costs | (12,893) | (11,042) | (11,207) |
Total capital expenditures | (13,076) | (11,129) | (11,691) |
Free cash flow | $21,787 | $13,672 | $19,288 |
Free cash flow conversion | 65% | 38% | 57% |
Reconciliation of Gross Profit Growth to Organic Gross Profit Growth
For the Year-over-Year Change Between the Nine Months Ended September 30, 2024 and 2023
(Unaudited)
Q3 Year-to-Date YoY Change | |
Gross profit growth | 8% |
Less: Growth from acquisitions and dispositions | (1%) |
Organic gross profit growth (n) | 9% |
(a) | See footnote (j) for details on amortization and depreciation expenses. | |
(b) | Reflects a gain on the repurchase of 2026 Notes principal, net of a write-off of debt issuance costs relating to the repurchased principal. | |
(c) | Reflects the changes in management’s estimates of the fair value of the liability relating to the Tax Receivable Agreement. | |
(d) | Represents compensation expense associated with equity compensation plans. | |
(e) | Primarily consists of (i) during the three and nine months ended September 30, 2024, the three months ended June 30, 2024 and the three months ended March 31, 2024, professional service fees incurred in connection with prior transactions, and (ii) during the three and nine months ended September 30, 2023 and the three months ended December 31, 2023, professional service fees and other costs incurred in connection with the disposition of Blue Cow Software. | |
(f) | Reflects costs associated with reorganization of operations, consulting fees related to processing services and other operational improvements, including restructuring and integration activities related to acquired businesses, that were not in the ordinary course. | |
(g) | For the three and nine months ended September 30, 2024, the three months ended June 30, 2024 and the three months ended March 31, 2024, reflects franchise taxes and other non-income based taxes, non-recurring legal and other litigation expenses and payments made to third-parties in connection with our IT security and personnel. For the three and nine months ended September 30, 2023 and the three months ended December 31, 2023, reflects non-recurring payments made to third-parties in connection with an expansion of our personnel, one-time payments to certain partners and franchise taxes and other non-income based taxes. | |
(h) | Reflects the loss recognized related to the disposition of Blue Cow. | |
(i) | For the nine months ended September 30, 2023, reflects impairment loss related to a trade name write-off of Media Payments. For the three months ended December 31, 2023, reflects non-cash goodwill impairment loss related to the Business Payments segment. | |
(j) | Reflects amortization of client relationships, non-compete agreement, software, and channel relationship intangibles acquired through the business combination with Thunder Bridge, and client relationships, non-compete agreement, and software intangibles acquired through REPAY's acquisitions of TriSource Solutions, APS Payments, Ventanex, cPayPlus, CPS Payments, BillingTree, Kontrol Payables and Payix. This adjustment excludes the amortization of other intangible assets which were acquired in the regular course of business, such as capitalized internally developed software and purchased software. See additional information below for an analysis of amortization expenses: |
Three Months ended September 30, | Nine Months ended September 30, | ||||
($ in thousands) | 2024 | 2023 | 2024 | 2023 | |
Acquisition-related intangibles | $19,111 | $19,786 | $58,549 | $60,673 | |
Software | 6,008 | 6,391 | 19,577 | 16,639 | |
Amortization | $25,119 | $26,177 | $78,126 | $77,312 | |
Depreciation | 410 | 346 | 1,202 | 1,834 | |
Total Depreciation and amortization (1) | $25,529 | $26,523 | $79,328 | $79,146 |
Three Months ended | |||||
($ in thousands) | December 31, 2023 | March 31, 2024 | June 30, 2024 | ||
Acquisition-related intangibles | $20,969 | $19,736 | $19,702 | ||
Software | 3,150 | 6,713 | 6,856 | ||
Amortization | $24,119 | $26,449 | $26,558 | ||
Depreciation | 592 | 579 | 213 | ||
Total Depreciation and amortization (1) | $24,711 | $27,028 | $26,771 |
(1) | Adjusted Net Income is adjusted to exclude amortization of all acquisition-related intangibles as such amounts are inconsistent in amount and frequency and are significantly impacted by the timing and/or size of acquisitions (see corresponding adjustments in the reconciliation of net income to Adjusted Net Income presented above). Management believes that the adjustment of acquisition-related intangible amortization supplements GAAP financial measures because it allows for greater comparability of operating performance. Although REPAY excludes amortization from acquisition-related intangibles from its non-GAAP expenses, management believes that it is important for investors to understand that such intangibles were recorded as part of purchase accounting and contribute to revenue generation. Amortization of intangibles that relate to past acquisitions will recur in future periods until such intangibles have been fully amortized. Any future acquisitions may result in the amortization of additional intangibles. |
(k) | Represents amortization of non-cash deferred debt issuance costs. |
(l) | Represents pro forma income tax adjustment effect associated with items adjusted above. |
(m) | Represents the weighted average number of shares of Class A common stock outstanding (on an as-converted basis assuming conversion of outstanding Post-Merger REPAY Units) for the three and nine months ended September 30, 2024 and 2023. These numbers do not include any shares issuable upon conversion of the Company’s convertible senior notes due 2026. See the reconciliation of basic weighted average shares outstanding to the non-GAAP Class A common stock outstanding on an as-converted basis for each respective period below: |
Three Months ended September 30, | Nine Months ended September 30, | |||||||
2024 | 2023 | 2024 | 2023 | |||||
Weighted average shares of Class A common stock outstanding - basic | 88,263,285 | 91,160,415 | 90,426,364 | 89,658,318 | ||||
Add: Non-controlling interests | ||||||||
Weighted average Post-Merger REPAY Units exchangeable for Class A common stock | 5,811,526 | 5,892,159 | 5,833,159 | 7,120,417 | ||||
Shares of Class A common stock outstanding (on an as-converted basis) | 94,074,811 | 97,052,574 | 96,259,523 | 96,778,735 |
(n) | Represents year-on-year gross profit growth that excludes incremental gross profit attributable to acquisitions and dispositions made in the applicable prior period or any subsequent period. |
View source version on businesswire.com: https://www.businesswire.com/news/home/20241112724651/en/
Investor Relations Contact for REPAY:
ir@repay.com
Media Relations Contact for REPAY:
Kristen Hoyman
(404) 637-1665
khoyman@repay.com
Source: Repay Holdings Corporation